Figures & data
Figure 1. (A) TEM images of the nanoparticles. (B) and (C) In vitro accumulative releases of insulin from the nanoparticles in pH 2.0 HCl and pH 7.4 PBS solutions at 37 °C (n = 3); individual insulin solution was assayed as the control.
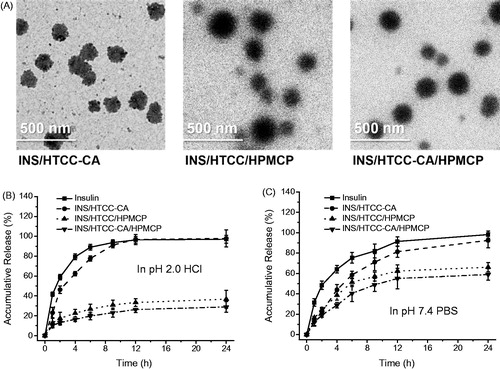
Table 1. Pharmacodynamics parameters after single subcutaneous injection of free insulin solution and gastric gavage with saline and the nanoparticles (n = 5).
Figure 2. Relative TEER changes of Caco-2 cell monolayers after incubation then remove of (A) free CA (100 μM) and the individual polymer (100 μg/mL), and (B) the nanoparticles with insulin concentration of 50 μg/mL; (C) apparent permeability coefficients of FITC-INS in Caco-2 cell monolayers after incubation with the FITC-INS loaded nanoparticles at insulin concentration of 50 μg/mL; the monolayers were pretreated with 100 μM free CA molecules for 30 min or not (n = 3). **p < .01.
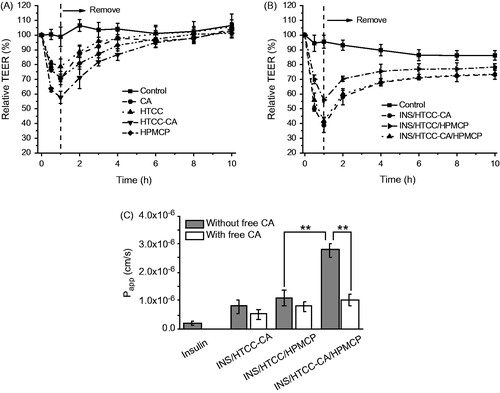
Figure 3. HepG-2 cellular uptakes after 4 h incubation with FITC-INS, FITC-INS/HTCC/HPMCP, and FITC-INS/HTCC-CA/HPMCP at insulin concentration of 50 μg/mL. (A) CLSM images of HepG-2 cells, and (B) geometric mean values of FITC-INS fluorescence intensities of the flow cytometry analysis (n = 3). The cell nuclei were stained with DAPI. **p < .01.
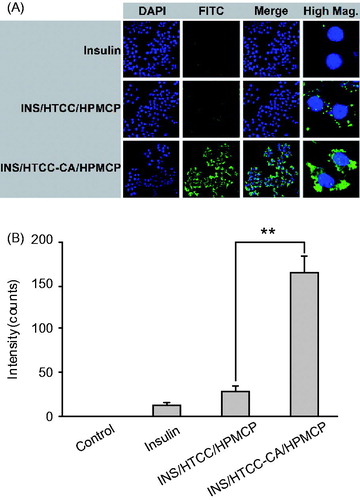
Figure 4. (A) CLSM images of ileum sections of the mice after oral administrations with Cy5-INS/RhB-HTCC-CA, Cy5-INS/RhB-HTCC/FITC-HPMCP, and Cy5-INS/RhB-HTCC-CA/FITC-HPMCP; the ileums were excised at 4 h post-administration. (B) Representative fluorescence images of the GI tracts excised at 0, 2, 6, and 12 h after oral administrations with Cy5-INS-loaded nanoparticles and (C) relative fluorescence intensity distributions of Cy5-INS/HTCC-CA/HPMCP in the GI tracts. (D) Representative fluorescence images of heart, liver, spleen, lung, and kidney excised at 0, 2, 6, 12 and 24 h after oral administrations with Cy5-INS loaded nanoparticles and (E) fluorescence intensities of liver after oral administrations with Cy5-INS loaded nanoparticles. The insulin dose was 30 IU/kg, n = 3, and *p < .05.
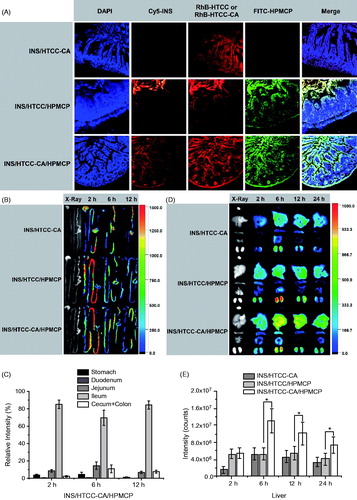
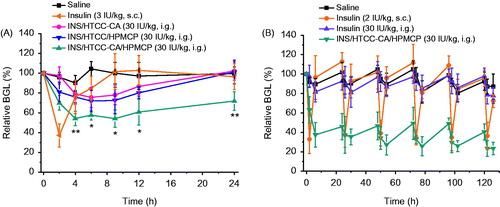
Figure 5. (A) Relative BGL changes of diabetic mice after single subcutaneous injection of free insulin solution at insulin dose of 3 IU/kg and gastric gavage with saline and the nanoparticles at insulin dose of 30 IU/kg (n = 5); *p < .05 and **p < .01 between INS/HTCC/HPMCP and INS/HTCC-CA/HPMCP groups. (B) Relative BGL changes of diabetic mice after subcutaneous injection of insulin at a dose of 2 IU/kg and oral administrations with saline, insulin, and INS/HTCC-CA/HPMCP at insulin dose of 30 IU/kg once daily for 5 d continually (n = 3 – 5).