Figures & data
Scheme 1. (A) The preparation scheme for sericin-PBLG-DOX micelles. (B) The permeability and retention (EPR) effect of sericin-PBLG-DOX in cancer region. (C) The working routine of sericin-PBLG-DOX during the treatment for drug resistance tumor cells.
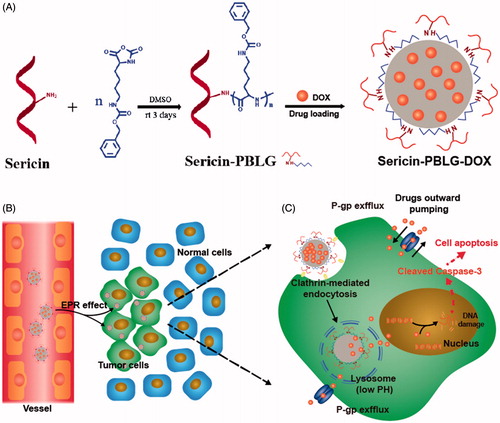
Figure 1. (A) 1H NMR spectra of sericin and sericin-PBLG. (B) FTIR spectra of sericin and sericin-PBLG. (C) The particle size and surface charge of sericin, sericin-PBLG, and sericin-PBLG-DOX micelles. (D) TEM images of sericin-PBLG and sericin-PBLG-DOX micelles. Scale bar, 50 nm. (E) pH-dependent release of DOX from sericin-PBLG-DOX micelles over 3 d (n = 3). (F) Stability of sericin-PBLG and sericin-PBLG-DOX micelles in PBS (pH 7.4, 0.1 M, 37 °C, n = 3).
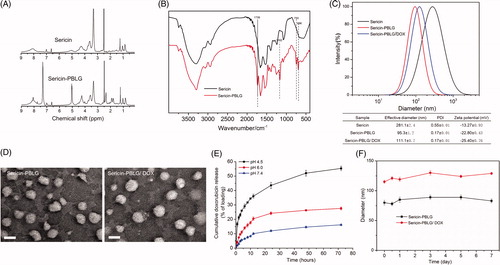
Figure 2. In vitro and in vivo biocompatibility of sericin-PBLG. (A) Assessment of the potential for hemolysis by different concentrations of sericin-PBLG nanomicelles. Triton X-100 was used as a positive control, and PBS was used as a negative control. (B) Cell viability of MCF-10 A cells and LO2 cells after incubation with sericin-PBLG. (C) Apoptosis rates of MCF-10 A cells and LO2 cells after incubation with sericin-PBLG. Data are shown as the mean ± SD, n = 3, N.S. indicates no significant difference. (D) Assessment of biochemical parameters in sera collected from mice treated with PBS or sericin-PBLG. AST, aspartate aminotransferase; ALT: alanine aminotransferase; TBIL: total bilirubin; UBIL: unconjugated bilirubin; BUN: blood urea nitrogen; UA: blood uric acid. (E) Histopathological analysis of major organ tissues isolated from Sprague-Dawley rats. Scale bar, 50 nm. Data are shown as the mean ± SD, n = 5 animals per treatment.
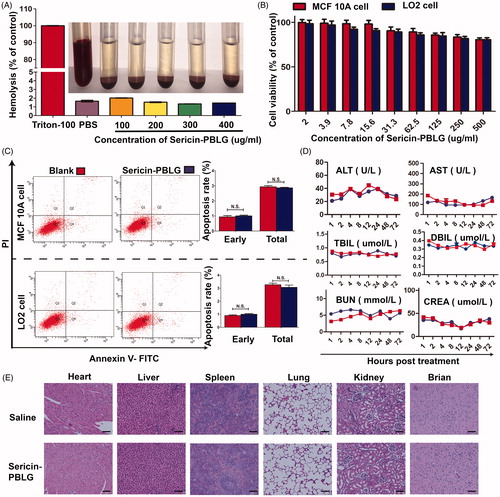
Figure 3. Cell uptake mechanism of sericin-PBLG-DOX. TEM images of the endocytosis of sericin-PBLG-DOX nanoparticle by MCF-7 ADR cells (A) and HepG2 ADR cells (B), the yellow arrows represent nanomicelles. Scale bar, 500 nm. CLSM images of MCF-7 ADR cells (C) and HepG2 ADR cells (D) treated with DOX, sericin-PBLG-DOX, or sericin-PBLG-DOX plus chlorpromazine. Scale bar, 500 nm. (E) The representative images (left) of the flow cytometry analyses of MCF-7 ADR and HepG2 ADR cells treated with sericin-PBLG, free-DOX, sericin-PBLG-DOX, and sericin-PBLG-DOX plus chlorpromazine for 4 h (left) and the corresponding quantification of the mean DOX red fluorescence intensity (right). Data are shown as the mean ± SD, n = 3. N.S. indicates no significant difference, ** indicates p < .01 and *** indicates p < .001.
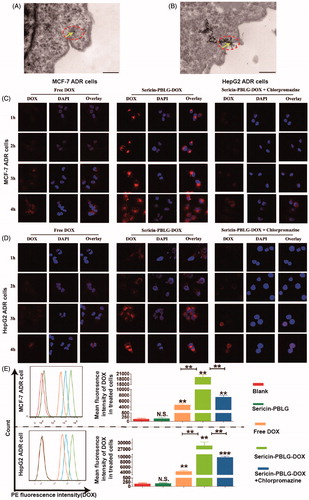
Figure 4. Intracellular distribution and pH-triggered drug release of sericin-PBLG-DOX. TEM images of MCF-7 ADR cells (A) and HepG2 ADR cells (B) after incubation with sericin-PBLG-DOX. Scale bar, 500 nm. CLSM images of MCF-7 ADR cells (C) and HepG2 ADR cells (D) with or without NH4Cl treatment in the presence of sericin-PBLG-DOX nanoparticles. Scale bar, 100 nm. The relative mean fluorescence intensity of DOX in the nucleus of MCF-7 ADR cells (E) and HepG2 ADR cells (F). Viability of MCF-7 ADR cells (G) and HepG2 ADR cells (H) with or without NH4Cl treatment in the presence of sericin-PBLG-DOX nanoparticles. The yellow arrows represent nanomicelles. Data are shown as the mean ± SD, n = 3. * indicates p < .05, ** indicates p < .01, and *** indicates p < .001.
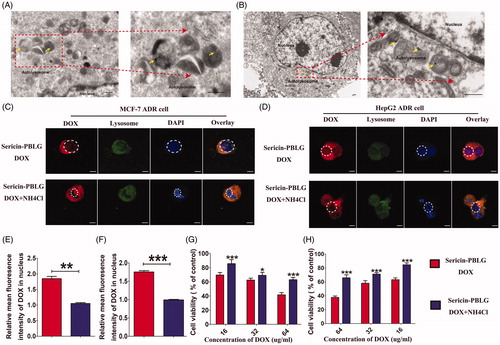
Figure 5. In vitro anti-tumor effect of sericin-PBLG-DOX. (A) Viabilities of MCF-7 ADR cells and HepG2 ADR cells after incubation with the sericin-PBLG nanocarrier. (B and C) Viabilities of MCF-7 ADR cells and HepG2 ADR cells after incubation with DOX or sericin-PBLG-DOX. (D) EdU assay of MCF-7 ADR cells and HepG2 ADR cells after incubation with DOX or sericin-PBLG-DOX. Scale bar, 200 nm. (E) Apoptosis rates of MCF-7 ADR cells and HepG2 ADR cells after incubation with DOX or sericin-PBLG-DOX. (F) Protein expression of P-pg, caspase-3, cleaved caspase-3 protein, and GAPDH in MCF-7 ADR cells, and HepG2 ADR cells after incubation with sericin-PBLG, DOX, or sericin-PBLG-DOX for 48 h (left), and the corresponding quantification of the gray value for each protein (right). Data are shown as the mean ± SD, n = 3, N.S. indicates p > .05, * indicates p < .05, ** indicates p < .01, and *** indicates p < .001.
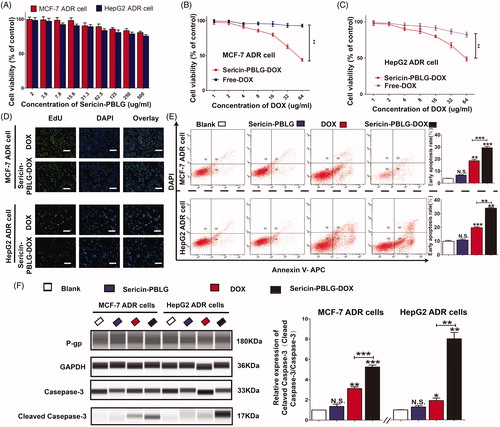
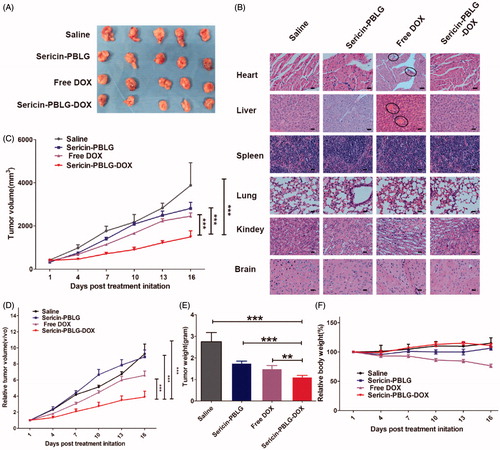
Figure 6. In vivo anti-tumor effect of sericin-PBLG-DOX. (A) Images of tumors derived from mice treated with drugs. (B) H&E images of the major organs. Scale bar, 50 nm. The regions circled with the black lines indicate the location of the potential lesion. (C) Volume of MCF-7 ADR tumors isolated from mice. (D) Relative volume of MCF-7 ADR tumors isolated from mice. (E) Weight of MCF-7 ADR tumors isolated from mice. (F) Relative body weight of MCF-7 ADR tumor-bearing mice. Data are shown as the mean ± SD, n = 5, **p < .01, ***p < .001, N.S. indicates p > .05.