Figures & data
Figure 1. Examining the stool smear under the microscope of A: plain group, B: high altitude group, and C: amoxicillin-administered plain group.
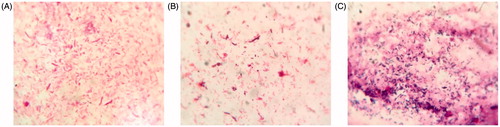
Figure 2. 16S rRNA analysis results (PF: fecal samples of plain group, H1F: fecal samples of hypoxia group.) of A: Venn diagram was shared OTU across different groups, B: PCA based on OTU abundance between two groups, C: Log-scaled percentage heat map of species level.
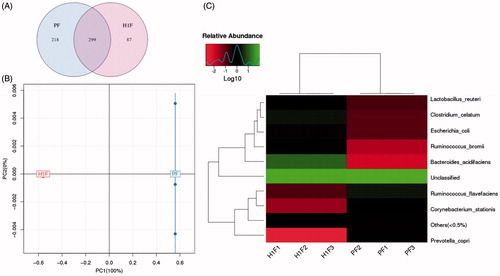
Table 1. Alpha diversity statistics.
Figure 3. The chromatograms of nifedipine and oxidation nifedipine in rat stool samples (A, B, and C were nifedipine, D, E, and F were oxidation nifedipine. 1, nifedipine, 2, nimodipine, 3, oxidation nifedipine). A: Blank fecal fluid, B: blank fecal fluid spiked with standard nifedipine, C: rat stool samples were incubated for 12 h, D: blank fecal fluid, E: blank fecal fluid spiked with standard oxidation nifedipine, and F: rat stool samples were incubated for 12 h.
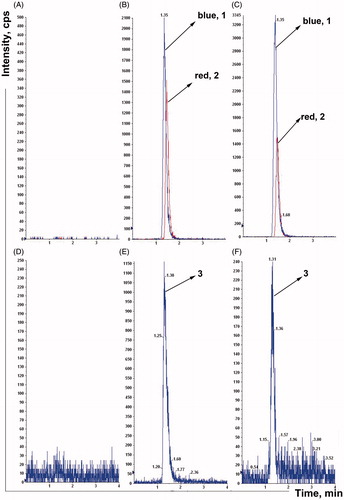
Figure 4. Nifedipine-metabolizing activities of rat fecal samples (P: plain rats; H: plateau hypoxia rats; P1: amoxicillin-treated rats.). A: the remaining amount of nifedipine after incubation for 12 and 24 h, B: formation of the oxidation nifedipine following incubation for 12 and 24 h. Data are expressed as mean ± standard deviation. C: Mean plasma concentration–time curve of nifedipine in rats at three groups. *p < .05, **p < .01 comparing with P. #p < .05, ##p < .01 comparing with P.
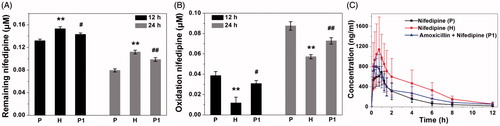
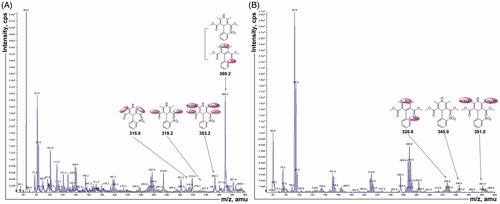
Figure 5. The mass spectrum of nifedipine by MS/MS. A: positive ion scan after incubation 12 h, B: negative ion scan after incubation 12 h.