Figures & data
Figure 1. The effect of LE and MIG on Nrf2 in L-02 cells exposed to TP. (A) Cells were pretreated with MIG, RIF or various concentrations of LE for 24 h, then exposed to TP for 18 h, finally cell viability of L-02 cells was measured by MTT assay, (x ± s, n = 6). Cells were treated with t-BHQ, MIG, or different concentrations of LE for 24 h, and then exposed to 80 nM TP for 18 h, finally, Nrf2 mRNA expression (B), Nrf2 total protein (C), nuclear Nrf2 (D) and cytoplasmic Nrf2 (E) in L-02 cells were determined. (x ± s, n = 6). *p < .05 versus control; #p < .05 versus TP group; ##p < .01 versus TP group.
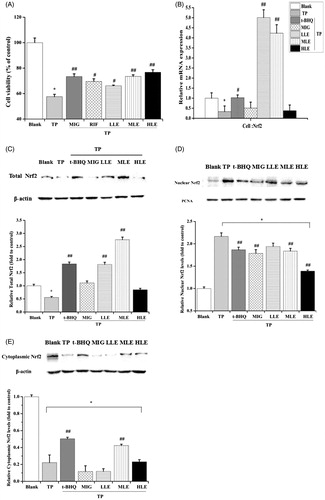
Figure 2. Nuclear translocation of Nrf2 in hepatocytes as demonstrated by immunofluorescent multi-staining. Immunoreactivity and colocalization of Nrf2 protein were analyzed in cells pretreated with t-BHQ, MIG, or different concentrations of LE for 24 h and then exposed to 80 nM TP for 18 h. Blue indicates nuclei (DAPI staining), red indicates cytoskeleton (phalloidin), and green indicates Nrf2. Original magnification 400× Bar =20 μm.
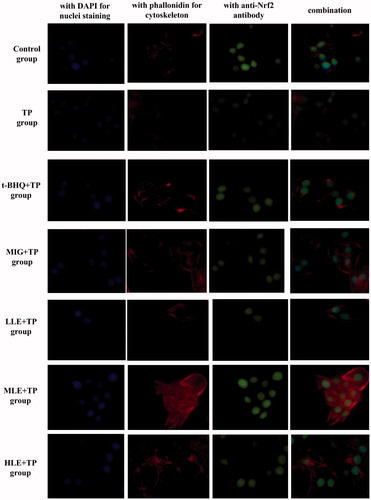
Figure 3. The effects of LE and MIG on UGT1A, MRP2, and BSEP in L-02 cells exposed to TP. Cells were treated with MIG, RIF or various concentrations of LE for 24 h, and then exposed to 80 nM TP for 18 h. The mRNA expression (A) and protein level (B) of UGT1A, MRP2, and BSEP were measured. Western blot gray value of UGT1A (C), MRP2 (D), and BSEP (E) from (B) are shown (x ± s, n = 6). *p < .01 versus control; #p < .05 versus TP group; ##p < .01 versus TP group.
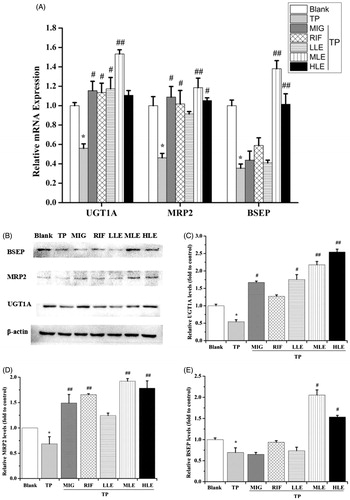
Table1. Comparison of serum ALT, AST, MDA, SOD, and GSH-Px levels among various groups (x ± s, n = 6).
Figure 4. Photomicrographs of HE-stained liver sections. Tissues were divided into 3-mm sections and stained with hematoxylin and eosin for light microscopic analysis. The photomicrographs are of livers obtained from (A) Control group, (B) TP group, (C) MIG + TP group, (D) RIF + TP group (E) LLE + TP group, (F) MLE + TP group, (G) HLE + TP group.
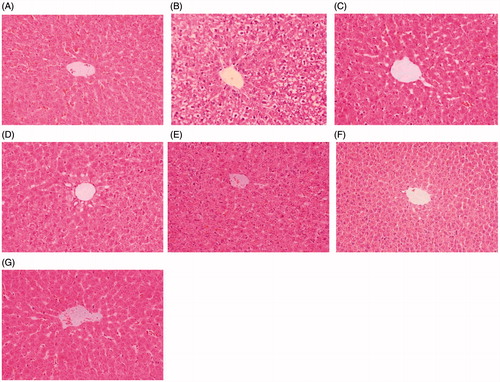
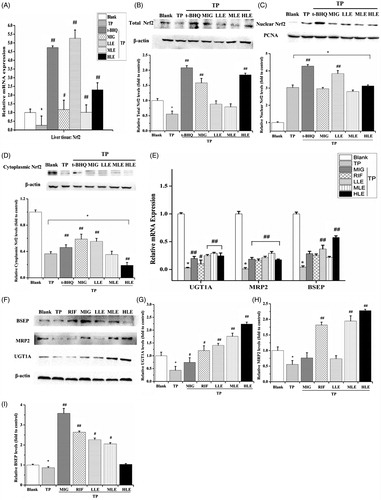
Figure 5. The effects of LE and MIG on Nrf2 pathway in rat liver tissues exposed to TP. Rats were treated with t-BHQ, MIG, and different concentrations of LE (for A–D); or MIG, RIF, and different concentrations of LE (for E–I) for 24 h and were then exposed to 80 nM TP for 18 h, finally liver tissues were collected. Nrf2 mRNA expression (A), Nrf2 total protein level (B), nuclear Nrf2 (C), cytoplasmic Nrf2 (D), mRNA expression (E) and protein (F) of UGT1A/MRP2/BSEP were detected in rat liver tissues. (x ± s, n = 6) *p < .01 versus control; #p < .01 versus TP group; ##p < .05 versus TP group. The western blot gray value of UGT1A (G), MRP2 (H), and BSEP (I) from (F) were measured (x ± s, n = 6). All results are expressed as the *p < .01 versus control; #p < .05 versus TP group; ##p < .01 versus TP group.