Figures & data
Scheme 1. (A) Synthesis of PSA-CC micelles. (B) Illustration of the compositions of PSA-CC/Dex micelles and FA-PSA-CC/Dex micelles.
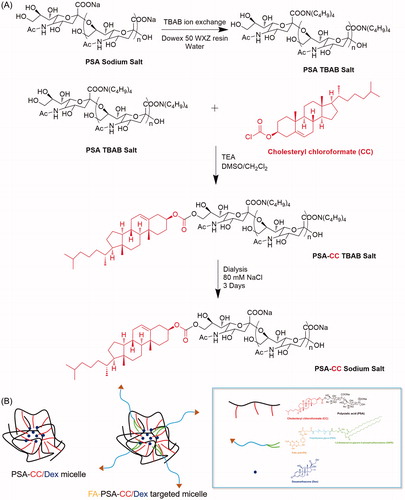
Figure 1. Characterization of the micelles. (A) FTIR spectrum of micelles and compositions for the blank micelles. (B) TEM image of PSA-CC micelles. (C) TEM image of FA-PSA-CC micelles. (D) Loading capacity and loading efficiency of PSA-CC/Dex micelles. (E) Loading capacity and loading efficiency of FA-PSA-CC/Dex micelles. (F) Particle size and PDI of FA-PSA-CC/Dex micelles. (G) Dex release from PSA-CC micelles and FA-PSA-CC micelles.
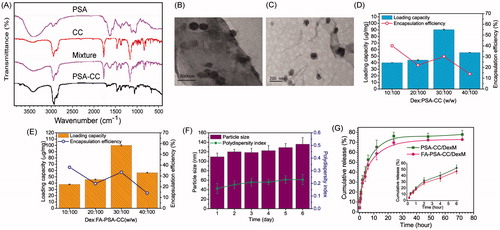
Figure 2. Inhibition rate of PSA-CC micelles and FA-PSA-CC micelles on RAW 264.7 cells (A) and GES-1 cells. (B) Concentration of TNF-α (C) and IL-6 (D) in RAW 264.7 cells with listed treatment.
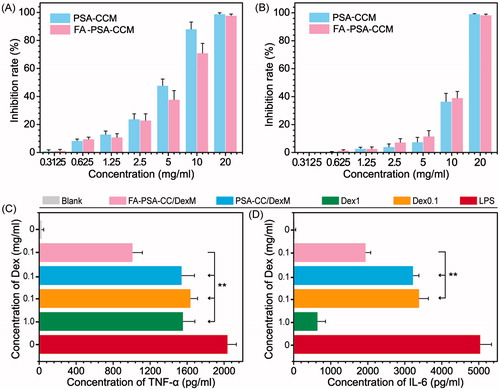
Figure 3. Cellular uptake of PSA-CC micelles and FA-PSA-CC micelles. (A) Fluorescent images of coumarin and coumarin-loaded micelle treated macrophages. (B) Flow cytometric graphs of fluorescent intensity of coumarin in macrophages that treated as listed.
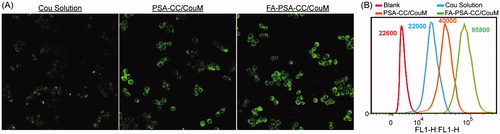
Figure 4. Paw thickness (A) and clinical index (B) of mice with listed treatment. Concentration of serum TNF-α (C) and IL-6 (D) in AIA mice with listed treatment. (E) Images of histological slides from AIA mice with listed treatment. Safety evaluation: the concentration of (F) White blood cell, (G) lymphocyte, (H) AST, and ALT in blood with listed treatment.
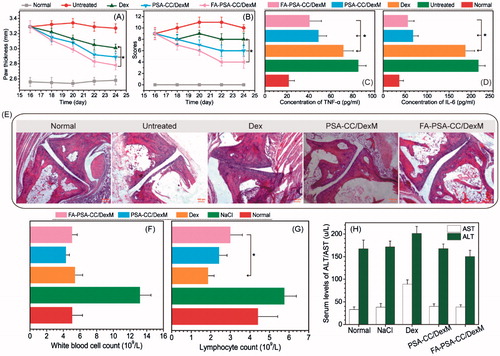
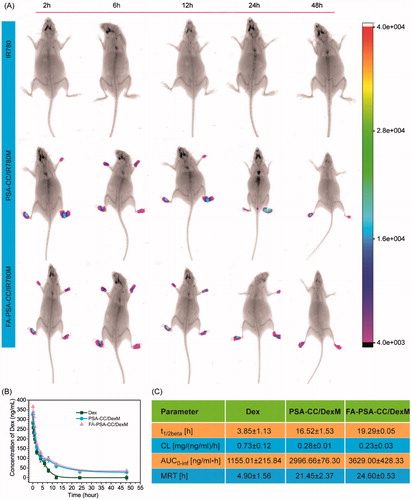
Figure 5. (A) Biodistribution of IR780, PSA-CC/IR780 micelles, and FA-PSA-CC/IR780 micelles in AIA mice. (B) Concentration of serum Dex in AIA mice with listed treatment. (C) Key pharmacokinetics parameters of Dex, PSA-CC/Dex micelles, and FA-PSA-CC/Dex micelles in AIA mice.