Figures & data
Figure 1. Viability of encapsulated C2C12-EPO myoblasts within 160 and 380 µm diameter alginate (0 µg/ml) and hybrid alginate-GO microcapsules (50 µg/ml), 1 and 7 d after microencapsulation: (A) Fold reduction of apoptotic cell percentage compared to microcapsules without GO quantified by flow cytometry of early apoptosis by means of annexin/PI staining and (B) Fold reduction of dead cell percentage compared to microcapsules without GO quantified by flow cytometry after calcein/ethidium staining. (C) Fluorescence and bright field microscopy images after calcein/ethidium staining. Scale bar 100 µm. Note *p < .05, **p < .01, and ***p < .001 compared with cells encapsulated in alginate without GO.
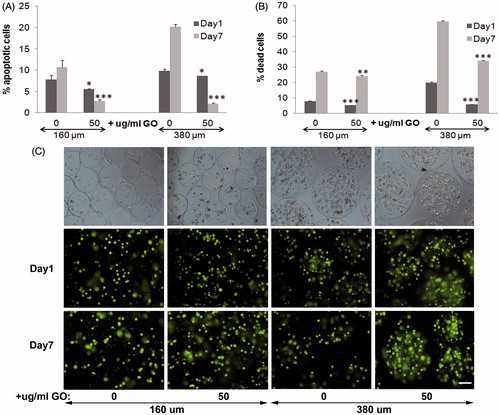
Figure 2. (A) Metabolic activity and (B) cell membrane integrity of encapsulated C2C12-EPO myoblasts within 380 µm diameter alginate and hybrid alginate-GO microcapsules (50 µg/ml), 1 and 7 d after microencapsulation. (C) EPO secretion 1 and 7 d after microencapsulation of C2C12-EPO myoblasts within 160 and 380 µm diameter alginate and hybrid alginate-GO microcapsules (50 µg/ml). Note *p < .05, **p < .01, and ***p < .001 compared with cells encapsulated in alginate without GO.
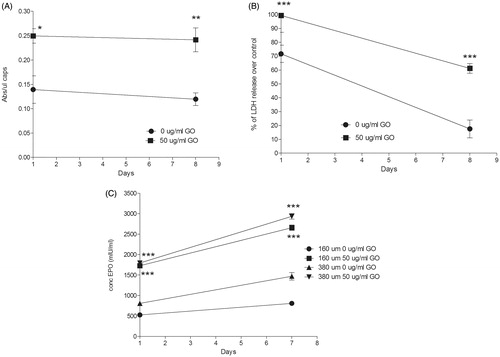
Figure 3. Viability of encapsulated D1-MSCs EPO within 160 and 380 µm diameter alginate and hybrid alginate-GO microcapsules (10, 25, and 50 µg/ml), 1 and 7 d after microencapsulation: (A) Quantification by flow cytometry of early apoptosis by means of annexin/PI staining and (B) live/dead percentage by means of calcein/ethidium staining. (C) Fluorescence microscopy images after calcein/ethidium staining. Scale bar 100 µm. Note ***p < .001 compared with cells encapsulated in alginate without GO.
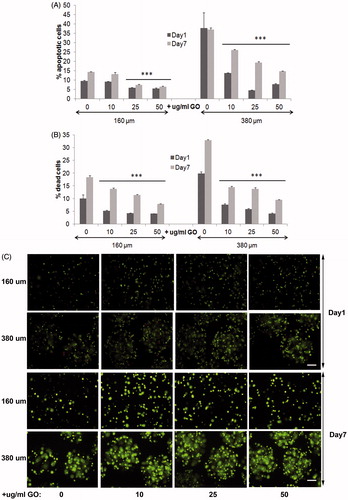
Figure 4. (A) Metabolic activity and (B) cell membrane integrity of encapsulated D1-MSCs EPO within 160 µm (left) and 380 µm (right) diameter alginate and hybrid alginate-GO microcapsules (10, 25, and 50 µg/ml), 1 and 7 d after microencapsulation. (C) EPO and (D) VEGF secretion 1 and 7 d after microencapsulation of D1-MSCs EPO within 160 and 380 µm diameter alginate and hybrid alginate-GO microcapsules (10, 25, and 50 µg/ml). Note *p < .05, **p < .01, and ***p < .001 compared with cells encapsulated in alginate without GO.
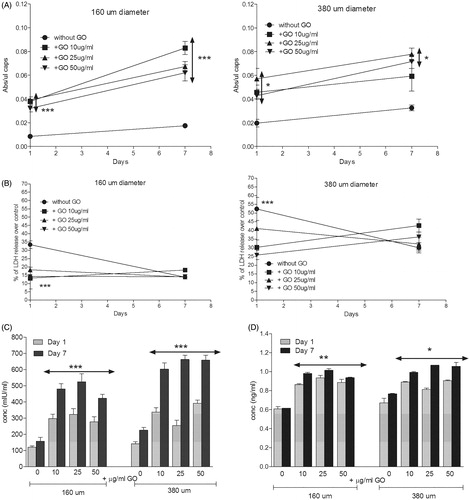
Figure 5. Subcutaneous allogenic implantation of encapsulated C2C12-EPO myoblasts and D1-MSCs EPO within 160 and 380 µm diameter alginate and hybrid alginate-GO microcapsules (50 µg/ml). (A) Hematocrit levels in C3H (left) and Balb/c (right) mice expressed as mean + SD after allogenic implantation. (B) Metabolic activity of retrieved encapsulated C2C12-EPO myoblasts from C3H mice (left) and encapsulated D1-MSCs EPO from Balb/c mice (right). (C) Fluorescence microscopy images after calcein/ethidium staining of the retrieved encapsulated cells. Scale bar 200 µm. Note **p < .01 and ***p < .001 compared with cells encapsulated in alginate without GO.
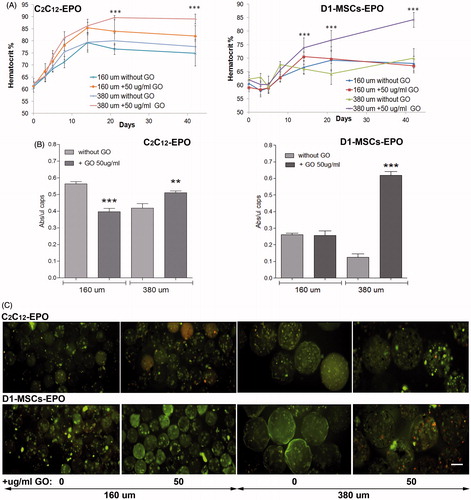
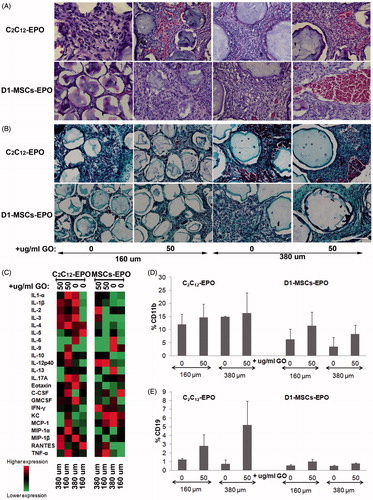
Figure 6. Foreign body reaction analysis 6 weeks after subcutaneous allogenic implantation of encapsulated C2C12-EPO myoblasts and D1-MSCs EPO within 160 and 380 µm diameter alginate and hybrid alginate-GO microcapsules (50 µg/ml). (A) Representative photographic images of hematoxylin-eosin staining of explanted grafts after 6 weeks (B) Representative photographic images of Masson's trichrome staining of explanted grafts after 6 weeks (C) Expression analysis of 23 inflammation-related cytokines by means of Bio-Plex Pro Mouse Cytokine 23-Plex Immunoassay. Flow cytometry quantification of D) CD11b and (E) CD19 percentage infiltrated cells from the retrieved fibrotic capsules. Note: Scale bar 100 µm.