Figures & data
Figure 1. (A) The biological activity of bevacizumab: (a) the effect of various stabilizer on bevacizumab activity; (b) the bevacizumab activity of Bev-MVLs containing 10% HAS was statistically significantly different from without HAS (mean ± SD, n = 3, **p < .01). (B) The morphological examination of Bev-MVLs: (a) light micrograph of Bev-MVLs particles at 400× magnification; (b) SEM image of Bev-MVL particles. (C) Particle size distribution of Bev-MVLs. (D) The morphology of FB-MVLs was observed at 400× magnification (a) bright-field image; (b) fluorescent image.
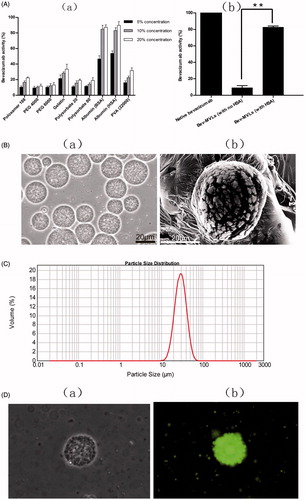
Figure 2. (A) In vitro release of Bev-MVLs (a) in three different mediums: normal saline, PBS (pH 7.4), and vitreous fluids; (b) coupled with different phospholipids (DOPC, EPC, and SPC) in vitreous fluids (mean ± SD, n = 3). (B) The morphological change of MVLs-DOPC at days 1, 3, 5, 7, 9, and 11 in vitreous fluids. (C) The results of SDS-PAGE for bevacizumab released from MVLs at scheduled intervals. Line 1: Marker; Line 2: free bevacizumab as a reference; Lines 3–9: bevacizumab released from MVLs at days 13, 11, 9, 7, 5, 3, and 1.
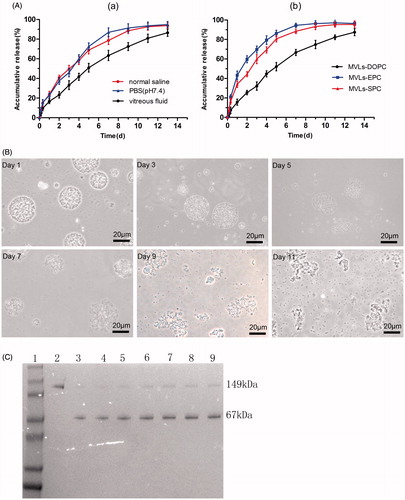
Table 1. The model parameters for the release of MVLs.
Figure 3. (A) In vivo imaging of SD rats after intravitreal injection of CB and CB-MVLs at 0.5, 1, 3, 7, and 14 days, respectively. (B) The concentrations of Bev-MVLs and Bev-S at 3, 7, 14, 21, 28, 42, and 56 days in vitreous humor, and (C) in aqueous humor. (D) The comparison of bevacizumab concentrations between the vitreous and aqueous humors after intravitreal injection of Bev-MVLs, and (E) of Bev-S (mean ± SD, n = 3).
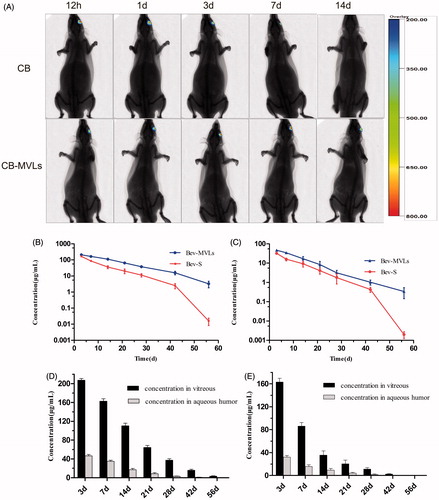
Table 2. Pharmacokinetic parameters of Bev-MVLs and Bev-S in the vitreous and aqueous humors following intravitreal injection (mean ± SD, n = 3).
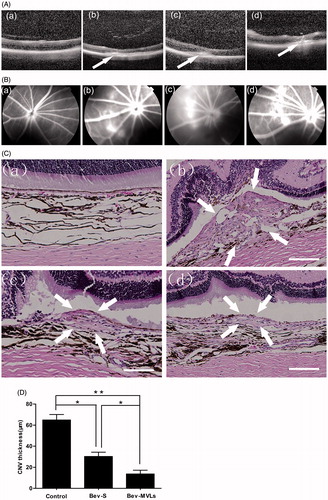
Figure 4. (A) OCT images of intraretinal layers cross-section (a) before photocoagulation; (b) 7 days after photocoagulation; (c) 14 days after photocoagulation; and (d) 21 days after photocoagulation. (B) FFA images: (a) before photocoagulation; (b) 7 days after photocoagulation; (c) 14 days after photocoagulation; and (d) 21 days after photocoagulation. (C) Histological images: (a) normal group without laser induction; (b) control group with 35 days after laser induction; (c) Bev-S group with 28 days after administration; and (d) Bev-MVLs group with 28 days after administration (white arrows indicate CNV lesion margins, scale bar, 50 μm). (D) BN rats treated with either Bev-S or Bev-MVLs had significantly thinner neovascular membranes than those in the control group (*p < .05, **p < .01, mean ± SD, n = 5).