Figures & data
Figure 1. Schematic illustration of the synthesis of the 99mTc-duramycin-Au DENPs (a). TEM image and size distribution of the duramycin-Au DENPs (b) and Au DENPs (c).
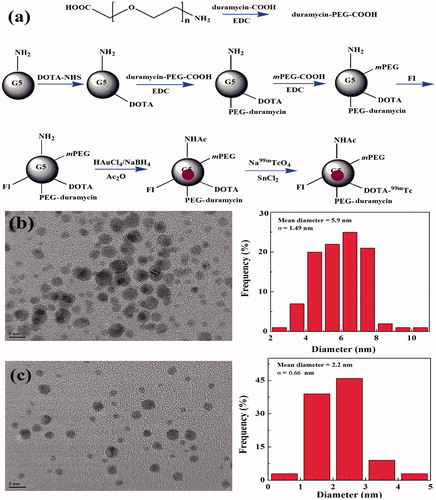
Figure 2. Confocal microscopy images of apoptotic C6 cells treated with PBS (a), Au DENPs (b), and duramycin-Au DENPs (c) at the Au concentration of 4 μM for 2 h, respectively.
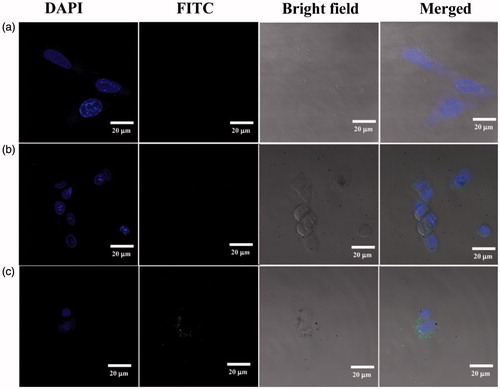
Figure 3. In vitro CT images (a) and the quantitative CT values (b) of apoptotic C6 cells treated with duramycin-Au DENPs or Au DENPs for 4 h at the different Au concentrations, respectively. In vitro SPECT images (c) and the quantitative SPECT signal intensity (d) of apoptotic C6 cells treated with 99mTc-duramycin-Au DENPs or 99mTc-Au DENPs for 4 h at the different radioactivity concentrations, respectively.
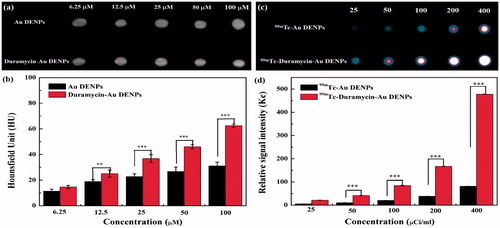
Figure 4. SPECT images (a) and tumor relative signal intensities (b) of the nude mice bearing C6 xenografted tumors after 3 days of DOX treatment at different time points post-intravenous injection of the 99mTc-duramycin-Au DENPs or 99mTc-Au DENPs. SPECT images of ex vivo tumors at 8 h post-injection (c). The white circle points to the tumor site.
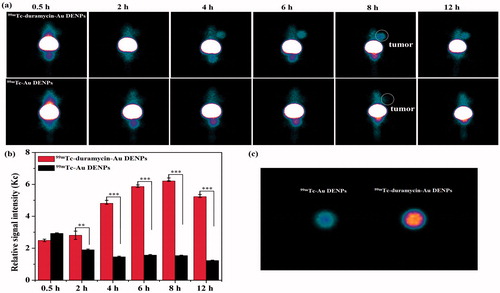
Figure 5. In vivo CT imaging images (a and b) and signal intensity (c) of tumors after intravenous injection of the duramycin-Au DENPs (a) or Au DENPs (b) at different time points post-injection. The white circle points to the tumor site.
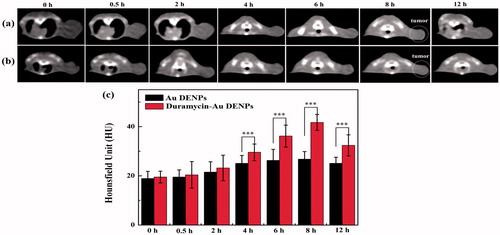
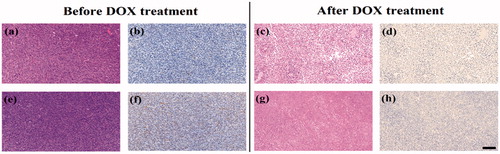
Figure 6. H&E staining (a, c, e, and g) and TUNEL assay (b, d, f, and h) of C6 xenografted tumors injected with 99mTc-duramycin-Au DENPs (a, b, c, and d) or 99mTc-Au DENPs (e, f, g, and h) before and after DOX treatment. The scale bar shown in all panels represents 200 μm.