
Figures & data
Table 1. 23 full factorial design layout for formulation of GBP rafts: factors and responses.
Table 2. Multiple reaction monitoring (MRM) conditions.
Figure 1. Light photos showing floating behavior of optimized GBP raft formula at different time intervals in 0.1 N HCl.
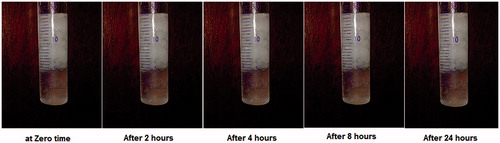
Figure 2. Normal plot of GBP raft formulae for screening of the influence of the studied factors.
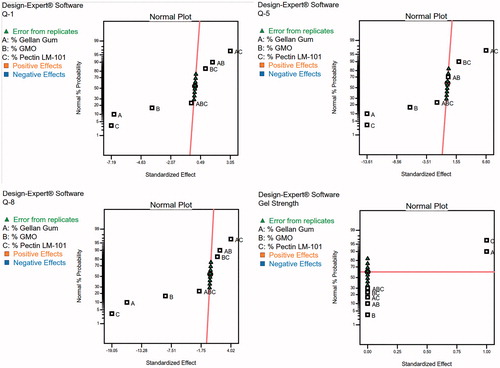
Table 3. Composition of the prepared GBP formulations in actual values (un-coded units) and their observed responses.
Table 4. Coefficient estimates for different model terms appearing in the final equation for each response and their significance levels.
Table 5. Coefficient estimates of the fitted regression model in terms of coded factors for the responses and the corresponding R2 values.
Figure 3. In vitro release profile of GBP before and after coating with Eudragit NE 30D.
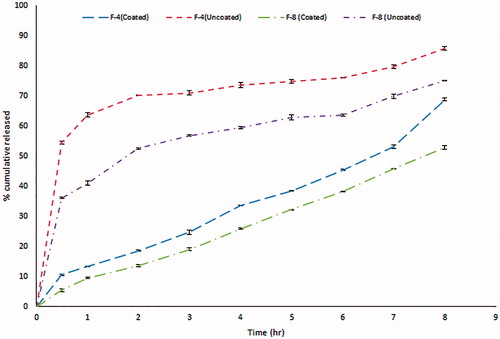
Figure 4. In vitro release profile of GBP in 0.1 N HCl (F-1 to F-8).
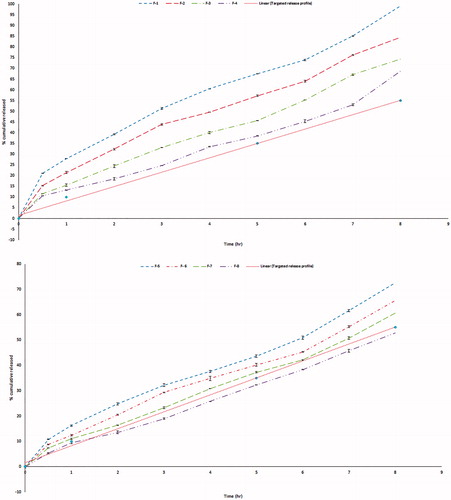
Figure 5. 3D surface plot of GBP raft floating formulae after 1 h release in 0.1 N HCl.
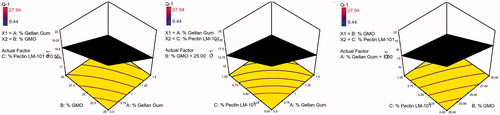
Figure 6. 3D surface plot of GBP raft floating formulae after 5 h release in 0.1 N HCl.
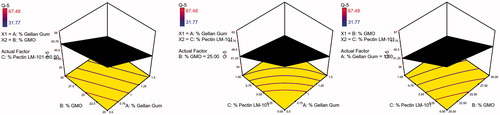
Figure 7. 3D surface plot of GBP raft floating formulae after 8 h release in 0.1 N HCl.
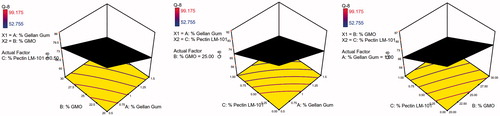
Table 6. The observed and predicted values for the optimized GBP raft formulation.
Figure 8. In vitro release profile of GBP from the optimized formula in 0.1 N HCl.
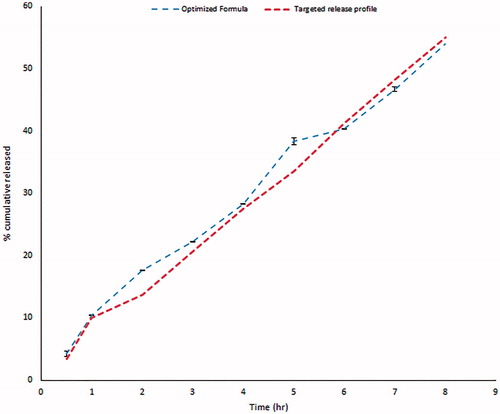
Figure 9. Viscosity of sols of different GBP formulae.
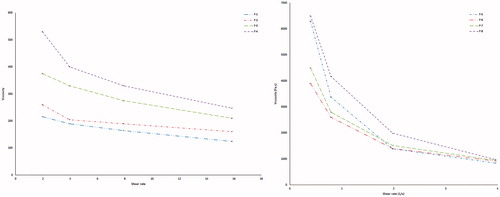
Table 7. Rheological behavior of different formulae in both sol and gel forms.
Figure 10. DSC thermograms of GBP, physical mixtures, and optimized formula.
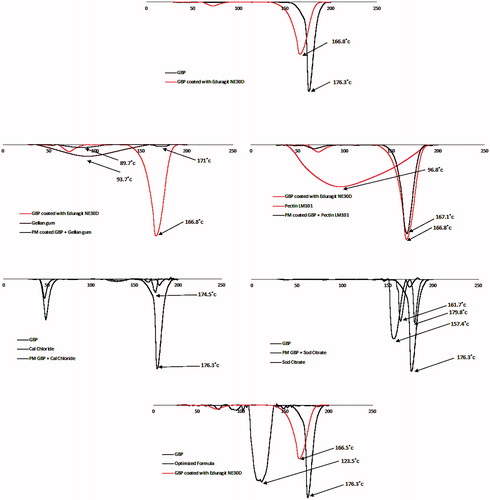
Figure 11. XRD diffractograms of GBP, physical mixtures, and optimized formula.
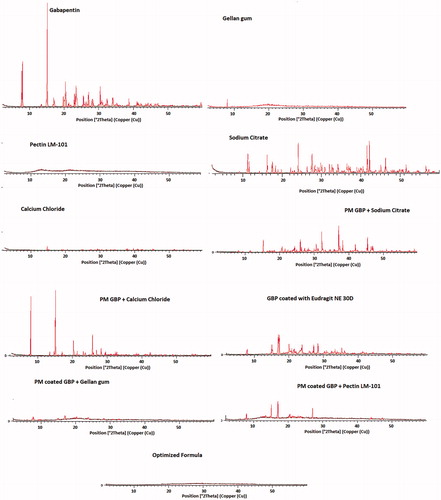
Figure 12. SEM of GBP pure drug crystals and GBP crystals coated with Eudragit NE 30D.
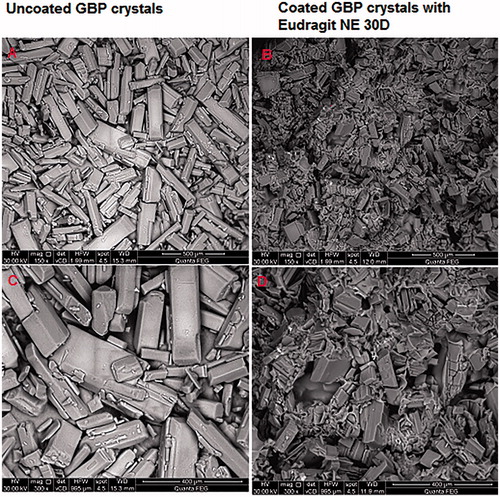
Figure 13. Light photos showing presence of gels in rat stomach at different time intervals after oral administration of optimized formula.
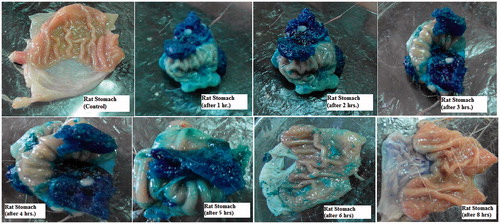
Figure 14. Average plasma concentration time profiles after single oral administration of both GBP raft forming systems and immediate release marketed Neurontin® oral solution to six human volunteers.
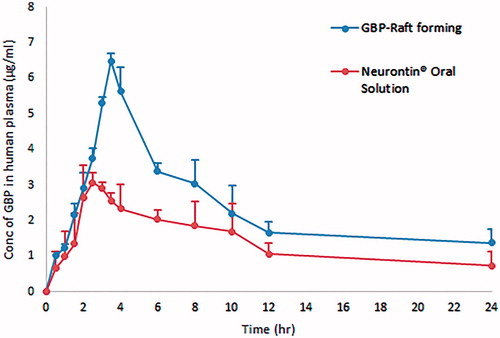
Table 8. Average pharmacokinetic parameters of both GBP raft forming systems and immediate release marketed Neurontin® oral solution following the administration to six human volunteers.