Figures & data
Figure 1. TEM images of (A) Pix-CL, (B) Pix-PL, and (C) Pix-PSL. The scale bars represent 200 nm.
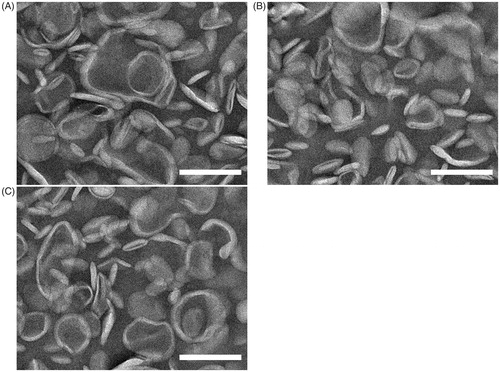
Table 1. Composition and characterization of liposomes (n = 3).
Figure 2. In vitro cellular uptake of DiR-labeled liposomes by PBNs after 30 min. (A) FCM analysis of the PBNs treated with DiR-CL, DiR-PL, DiR-PSL, and DiR-PSL (PSA). (B) Quantitative analysis of the FCM data (**p < .01). (C) Confocal images of the PBNs incubated with DiR-CL, DiR-PL, DiR-PSL, and DiR-PSL (PSA). The scale bars represent 10 μm. Data are shown as mean ± S.D. (n = 3).
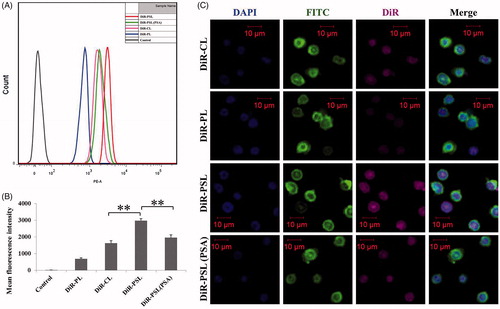
Figure 3. Cellular uptake of DiR-CL/PBNs, DiR-PL/PBNs, and DiR-PSL/PBNs by A549 cells in vitro after two hours. (A) FCM analysis of the A549 cells treated with DiR-CL/PBNs, DiR-PL/PBNs, and DiR-PSL/PBNs. (B) Quantitative analysis of the FCM (**p < .01). (C) Confocal images of the A549 incubated with DiR-CL/PBNs, DiR-PL/PBNs, and DiR-PSL/PBNs. The scale bar represents 20 μm. Data are shown as mean ± S.D. (n = 3).
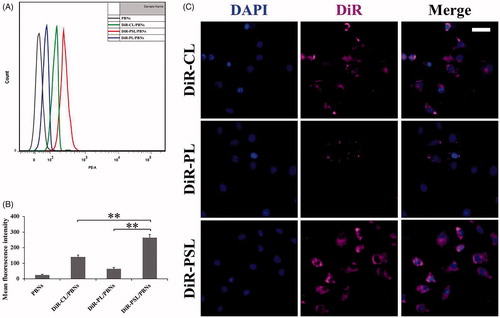
Figure 4. In vivo fluorescence imaging of the A549 tumor-bearing mice at different time points following injection of (A) PBN containing DiR-labeled liposome models. Following this, (B) the tumors from the PBN containing DiR-labeled liposomes group were harvested and imaged by ex vivo fluorescence. (C) The PBN containing the DiR-labeled liposomes accumulated in tumors was measured by a ROI analysis of the DiR signal variation. Data are shown as mean ± S.D. (n = 3) (**p<.01, ***p<.001).
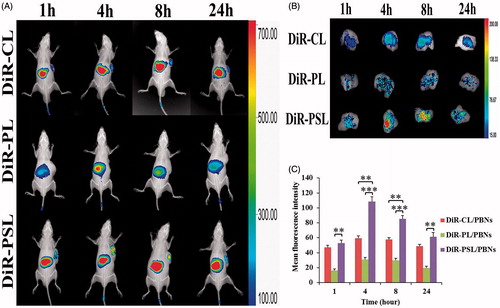
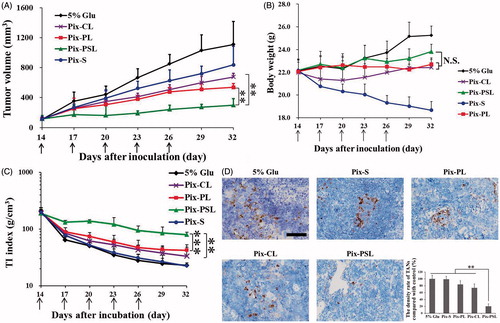
Figure 5. (A) Tumor growth curve of A549 tumor-bearing mice injected with the different Pix formulations. (B) Body weight change in A549 tumor-bearing mice administered with the different Pix formulations. (C) Tumor-inhibition index change in A549 tumor-bearing mice administered with the different Pix formulations. (D) Immunohistochemistry staining of different experimental groups within tumor stroma. The scale bar represents 50 μm. Data are shown as mean ± S.D. (n = 5–6). The black arrows represent the injection of Pix formulations. N.S. represents not significant (p > .05) (**p < .01, ***p < .001).