Figures & data
Figure 1. Time courses of dhy changes for HLs at 25 °C. The values are represented as the mean ± S.E. Arrow: precipitation.
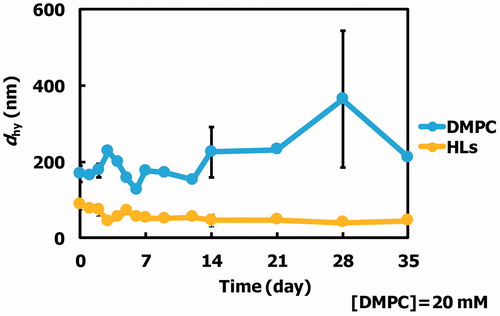
Figure 2. (A) 50% inhibitory concentration (IC50) for HLs and DMPC liposomes on the growth of HCT116 cells after 48 h. The values represent the mean ± S.E. *p < .05 (vs. DMPC). (B) Apoptosis rate for HCT116 cells treated with HLs for 48 h. The values represent the mean ± S.E. *p < .05 (vs. DMPC). (C) Time course of fluorescence polarization (p value) changes for DPH-labeled HCT116 cells after treatment with HLs.
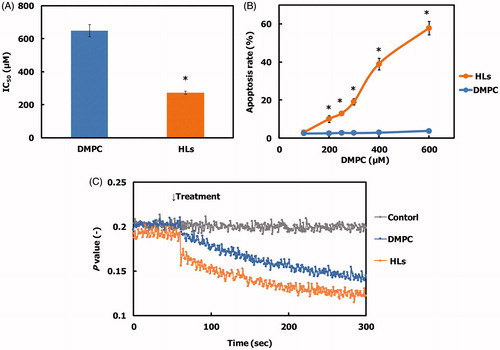
Figure 3. (A) Relative cecum weight of the orthotopic graft model mice treated with HLs after inoculation with HCT116 cells in the cecum. The values represent the mean ± S.E. *p < .05 (vs. control, DMPC). (B) Photographs of cecum in the orthotopic graft model mice treated with HLs after inoculation of HCT116 cells to the cecum. Circle: tumor. Scale bar: 1 cm.
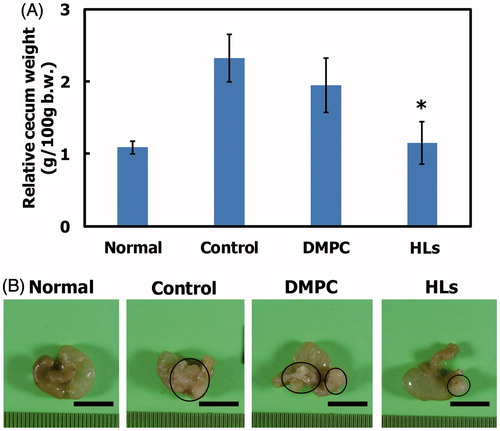
Figure 4. (A) Micrographs of HE staining of the cecum in the orthotopic graft model mice after treatment with HLs. Scale bar: 1 mm. (B) Micrographs of TUNEL staining of cecum tissue sections from the orthotopic graft model mice after treatment with HLs. Arrows: apoptotic cells. Scale bar: 100 μm.
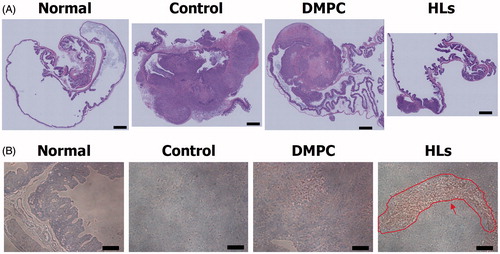
Figure 5. (A) Fluorescence micrographs of HCT116 cells after treatment with HL/ICG for 3 h. (B) Fluorescence micrographs of normal colon cells after treatment with HL/ICG for 3 h. Scale bar: 50 μm.
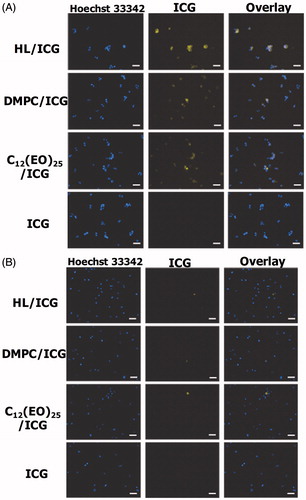
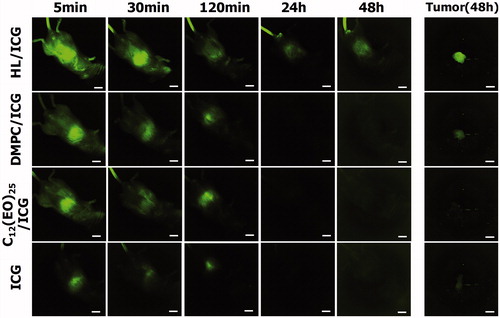
Figure 6. Long-term accumulation of HLs encapsulating ICG in the tumors in the orthotopic graft model mice four weeks after inoculation with HCT116 cells. Scale bar: 1 cm.