Figures & data
Figure 1. (A) CO release from HbV (open circle) or CO-HbV (closed circle) in the presence of 100% FBS. Either HbV or CO-HbV was mixed with 100% FBS in a glass vial. At stipulated time after mixing, the CO concentration in the head space of the glass vial was determined using gas chromatography with a CO-analyzer. Data are mean ± SD (n = 3 per group). (B) CO concentration in blood after CO-HbV administrating to healthy mice. Mice were single injected CO-HbV, and CO concentrations in blood were measured using CO analyzer. Data are mean ± S.D. (n = 4).
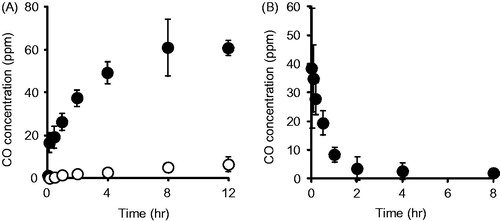
Figure 2. The changes of mRNA expression of (A) TNF-α, (B) NOS2, (C) CD163 and (D) MRC1 after incubation with either M1-trophic cytokines (LPS and IFN-γ), M2-trophic cytokines (IL-13 and IL-4), CO-HbV or HbV in RAW 264.7 cells. TNF-α and NOS2: M1 macrophage marker, CD163 and MRC1: M2 macrophage marker. Error bars indicate the S.E. of six separate experiments. *p < .05,**p < .01 versus non-treatment.
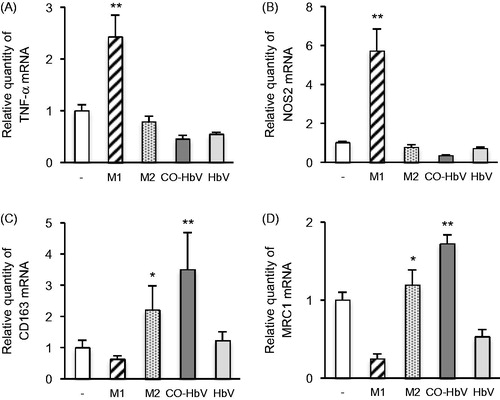
Figure 3. The plasma levels of (A) amylase, (B) lipase and (C) pancreatic weight after CO-HbV administrating to acute pancreatitis model mice. Data are mean ± S.D. (n = 6 per group). **p < .01 versus control. (D) Micrographs of pancreas slides stained with HE. (E) Immunological staining of pancreatic slices for MPO (red, upper) and NO2-Tyr (red, lower). Blue staining represents the nuclei immunostained with DAPI (counterstain). Scale bars: 100 μm.
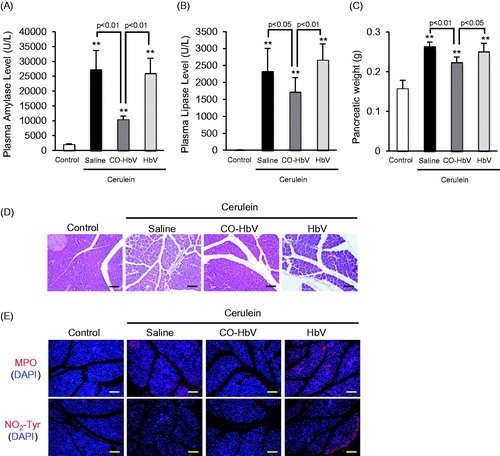
Figure 4. M1 and M2 polarization of macrophages in the pancreas of acute pancreatitis model mice. The mRNA expressions of (A) NOS2, (B) TNF-α, (C) IL-10, and (D) MRC1 were determined using pancreas tissue collected at 12 h after the start of cerulein administration. Data are mean ± S.E. (n = 6 per group). **p < .01 versus control.
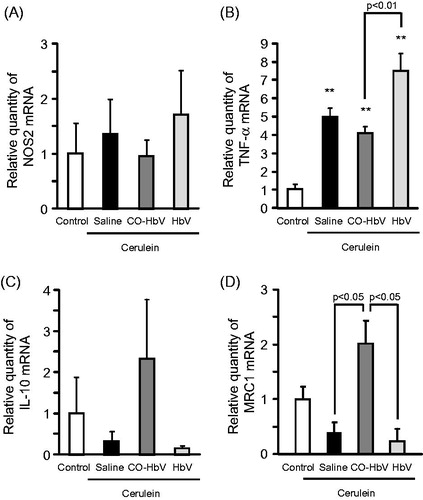
Figure 5. The levels of (A) TNF-α, (Β) IL-6, (C) IL-1β, and (D) IL-10 in the pancreas of acute pancreatitis model mice. Pancreas tissue collected at 12 h after the start of cerulein administration. Data are mean ± S.D. (n = 6 per group). **p < .01 versus control.
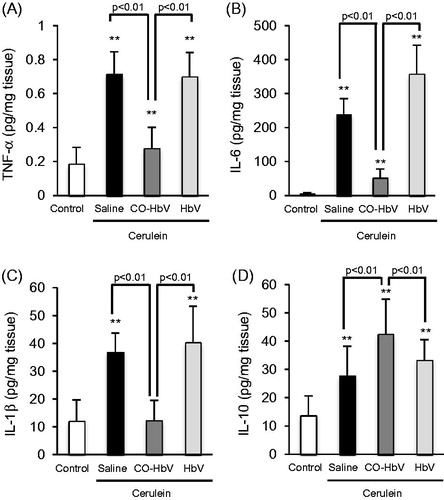
Figure 6. Evaluation of distant lung injury after CO-HbV treatment in acute pancreatitis model mice. (A) Lung wet/dry ratio were determined using one lobe of the left lung collected at 12 h after the start of cerulein administration. Data are mean ± S.D. (n = 6 per group). **p < .01 versus control. (B) Micrographs of lung section stained with HE and (C) immunological staining of lung slices for MPO (red, upper) and NO2-Tyr (red, lower). Blue staining represents the nuclei immunostained with DAPI (counterstain). Scale bars: 100 μm.
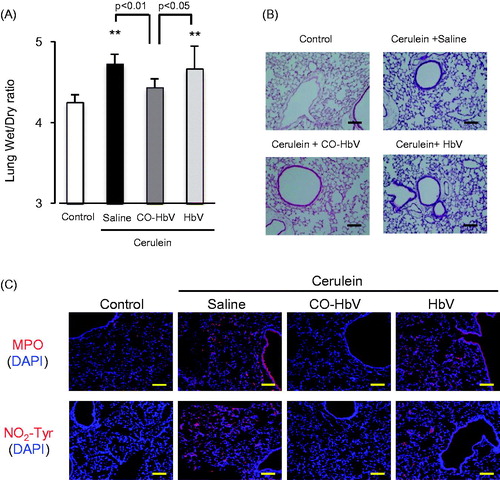
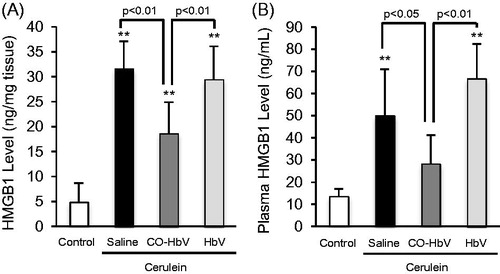
Figure 7. Pancreatic and plasma HMGB1 levels in acute pancreatitis model mice. HMGB1 level in (A) the pancreas and (B) plasma were determined using pancreas and plasma collected at 12 h after the start of cerulein administration. Data are mean ± S.D. (n = 6 per group). **p < .01 versus control.