Figures & data
Table 1. Factors studied and respective levels investigated in the 52 full factorial design used for the preparation of proniosomal gel formulations together with the dependent variables and their required constraints.
Table 2. Composition of the prepared Dorzolamide-HCl proniosomal gel formulations and the characterization of their respective niosomes. Data are represented as (mean ± SD).
Table 3. Significance of different model terms appearing in the final model for each response, together with models evaluation.
Figure 1. (a) and (b): Interaction plots of Cholesterol and Span 40 for the responses of: (a) Percentage entrapment efficiency and (b) Particle size, (c) and (d): Effects plots for the response of Q8h: (c) Cholesterol effect and (d) Span 40 effect.
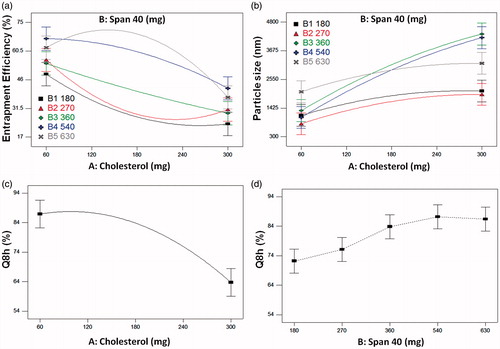
Figure 2. (a) Release profiles of Dorzolamide-HCl from OF-gel before and after sterilization compared to that from optimized formulation (OF), Dorzolamide-HCl solution and Trusopt® eyedrops, (b) Transmission electron image of Dorzolamide-HCl loaded niosomes of optimized formulation negatively stained with potassium phophotungustate.
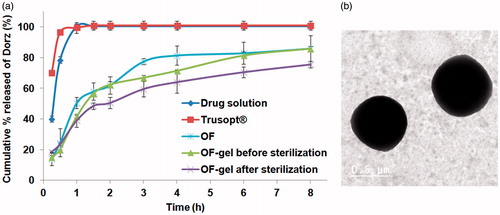
Table 4. Predicted values of different responses for the optimized formulation (OF) compared to the actual values together with the prediction intervals and percent deviations.
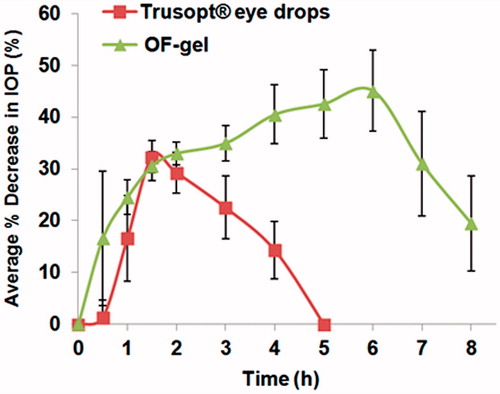
Figure 3. Average percentage decrease in intraocular pressure after administration of the OF-gel and Trusopt® eye drops to rabbits.