Figures & data
Figure 1. Synthesized process of PEGylated TA and structural characterization of PEGylated TA (mPEG2K-SA-TA) by 1H-NMR spectrum, FT-IR spectrum, MALDI-TOF spectrum.
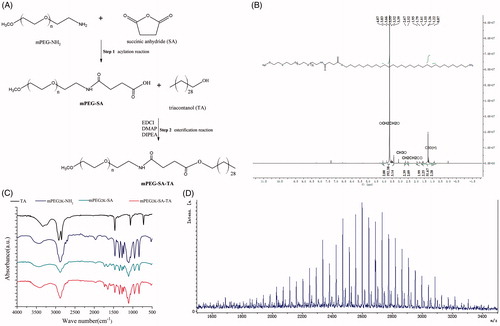
Figure 2. Cytotoxicity assay ofmPEG2K-SA-TA on L02, MCF7 and LoVo (A); Apoptotic rates (%) induced by mPEG2K-SA-TA in medium for 4, 12, 24 and 48 h determined by FCM (B); Changes of relative tumor volume after treatment with saline, cisplatin, mPEG2K-SA-TA (400 or 500 mg/kg, n = 10) (C); Representative photos of tumor tissues at the end of experiments (D); The weights of excised tumors from different groups of nude mice bearing LoVo tumor (E); H&E staining of vital organs after treatment with saline, cisplatin, 400 and 500 mg/kg mPEG2K-SA-TA (F); Representative TUNEL, CD31 and Ki67 immunohistochemical images of tumors from different groups (G); Tissue distributions of TA into heart, liver, spleen, lung and kidney after treatment with saline, cisplatin, 400 and 500 mg/kg mPEG2K-SA-TA (H) *p < .05, **p < .01, ***p < .001 vs. control group.
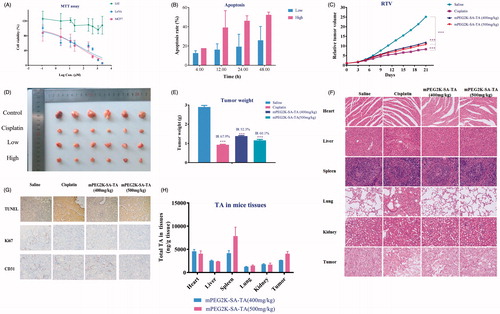
Figure 3. Western blot and qPCR analysis of tumors and cells. NF-κB translocation to nucleus was suppressed by mPEG-2K-SA-TA treatment in tissues from nude mice bearing LoVo cells (A) and in vitro LoVo cells (D), the nuclear protein was analyzed by Western blot using Histone H1 as reference protein; The expression of MMP9 was obviously inhibited by mPEG-2K-SA-TA in tissues from nude mice (B) and in vitro LoVo cells (E); The protein expression of VEGF was also decreased by mPEG-2K-SA-TA in tissues from nude mice bearing LoVo cells LoVo cells (C) and in vitro LoVo cells (F); Both MMP9 and VEGF were measured by Western blot using β-actin as reference protein. mRNA expressions of MMP9 and VEGF in tumor tissues (G, H) from nude mice bearing LoVo cells and in vitro LoVo cells (I, J) determined by Q-PCR. *p < .05, **p < .01, vs. control group.
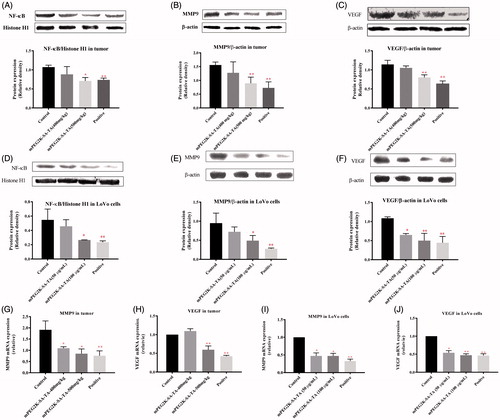
Figure 4. Plasma concentration–time profiles (A) and pharmacokinetic parameters (Cmax, t1/2, AUC0−t and MRT, correspondently depicted as B, C, D and E, respectively) of pristine TA after i.v administration of TA solution (3 mg/kg), free TA and total TA after direct extraction or saponification following i.v. administration of mPEG2K-SA-TA (TA equivalent, 3 mg/kg), **p < .01, ***p < .001.
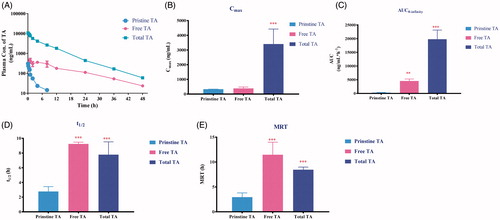
Figure 5. Hemolytic test of drug-free mPEG2K-SA-TA solution (1, 2, 5 and 10 mg/mL). The photo was taken after 3 h reaction (A). Negative control was treated with physiological saline, positive control was treated with distilled water (B); Acute toxicity evaluations in BALB/c mice treated with PEG2K-SA-TA solution (C–K), including blood test (WBC, HGB, RBC and PLT) and serum biochemical index analysis (ALT, AST, CREA, and BUN).
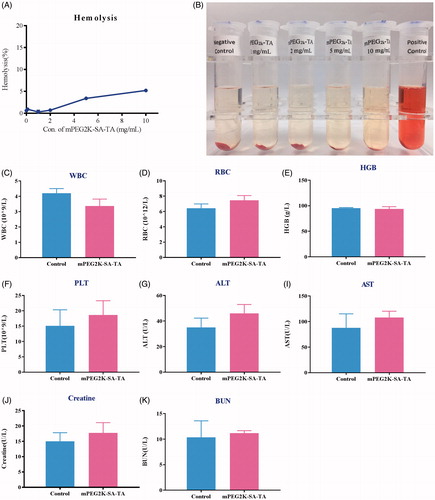
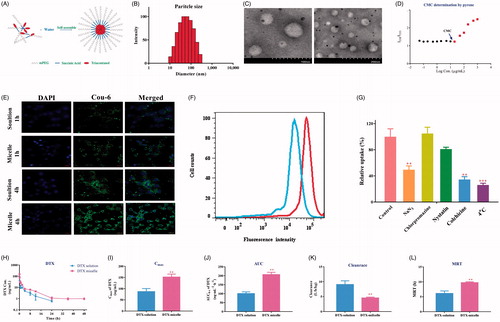
Figure 6. Characterization of PEGylated TA polymer micelles (A); Particle size distribution (B); TEM images (the scale bar at 100 and 200 nm) (C); CMC determination using pyrene as a fluorescence probe (D);. CLSM images of LoVo cells after 1 h or 4 h of incubation with mPEG2K-SA-TA polymer-loaded Coumarin-6 or free Coumarin-6 solution (scale bar at 20 μm) (E); Fluorescence intensity of Coumarin-6 in LoVo cells treated with Coumarin-6 solution of mPEG2K-SA-TA micelle loading Coumarin-6 obtained by flow cytometry (F); Cellular relative uptake of mPEG2K-SA-TA polymer in LoVo cells after 2 h-incubation at 4 or 37 °C with the presence of various inhibitors (including NaN3, chlorpromazine, nystatin and colchicine) or not (control group) (G); Plasma concentration–time profiles of DTX in rats following intravenous administration of DTX solution or DTX micelle (encapsulated by mPEG2K-SA-TA) at 1 mg/kg (H); Pharmacokinetic parameters after i.v. administration of the DTX loaded by mPEG2K-SA-TA micelles and DTX solution at a dose of 1 mg/kg (mean ± SD, n = 4) (I–L).