Figures & data
Figure 1. Optimization of the formulation by checking the particle size of reconstituted blank micelles using DLS: effect of various (a) surfactants (0.5%) and (b) protectants (4%) on the reconstitution of blank micelles (0.1%) made by PBS (blank micelle/PBS) and DW (blank micelle/DW). (c) Particle size of the reconstituted blank micelles depending on the amount of PEG 2K. Effect of (d) Man and (e) glycine on the particle size of reconstituted blank micelle. Combination of surfactant (PEG 2K, 0.5%) and protectant (Man or glycine, 0.5%) showed the most similar particle size of reconstituted micelle with the original one without any excipients before lyophilization.
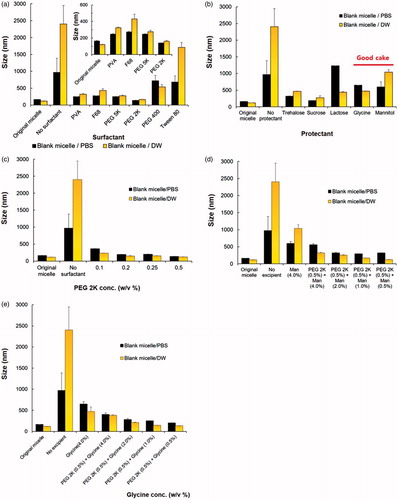
Figure 2. Characterization of DTBM (targeting 10%). (a) Particle size distribution by DLS and (b) morphologies by FE-SEM.
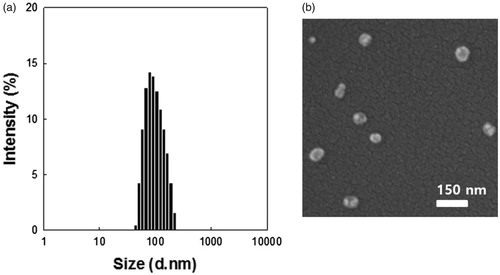
Table 1. Characterization of DTBM (n = 3).
Figure 3. Optimization and characterization of DTBM-R. (a) Effect of excipients with different concentrations on reconstitution of DTBM-R using PBS and DW that includes PEG 2K (0.5 w/v %) as a surfactant and Man (0.5 w/v %) as a protectant. (b) Comparison of reconstitution: Successful reconstitution of DTBM-R containing PEG and Man and poor reconstitution of lyophilized polymeric micelles without excipients. (c) Drug release profile and (d) cytotoxicity in KB cells treated with the Nanoxel M, DTBM, or DTBM-R for 48 h.
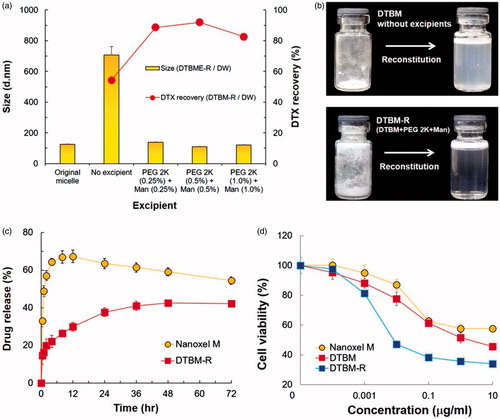
Figure 4. Non-invasive in vivo fluorescent imaging of Cy5.5-tagged micelles after intravenous injection into the tail vein of KB tumor-bearing nude mice. (a) Whole body imaging at predetermined time points after i.v. injection. (b) Ex vivo optical and fluorescent imaging of tumor and organs obtained 24 h post-injection. (c) Relative biodistribution of PEG-PLA-PEG micelles by quantitative fluorescence intensity (FI) of tumors and main organs. The relative biodistribution of the spleen, liver, and kidney compared to the tumor was 33.3%, 10.1%, and 14.8%, respectively. In vivo (d) relative tumor volume and (e) body weight in KB tumor-bearing mice injected with saline (control), PEG–PLA–PEG, Nanoxel M, docetaxel-loaded triblock micelle (DTBM) (equivalent to 2 mg/kg DTX, n = 3). Relative tumor volume was defined as volume ratio of tumor at predetermined time intervals (0–15 days) compared to the initial volume.
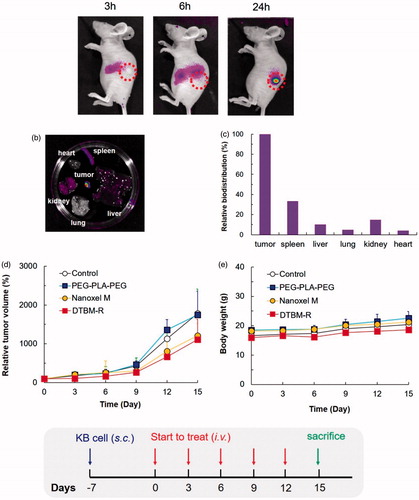
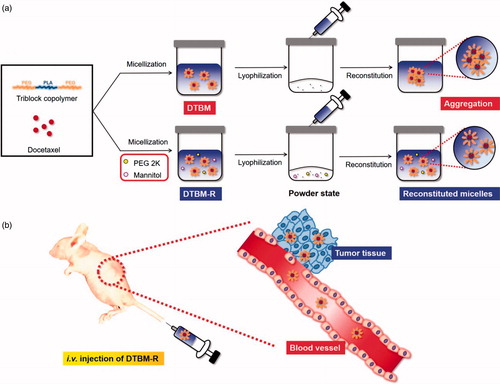
Figure 5. Schematic concept of docetaxel-loaded micellar formulation using PEG–PLA–PEG. (a) Preparation of DTBM-R using PEG 2K and Man for successful reconstitution and (b) proposed in vivo performance of DTBM-R after i.v. administration.