Figures & data
Figure 1. Scheme of the fabrication process of DOX/HACE MS.
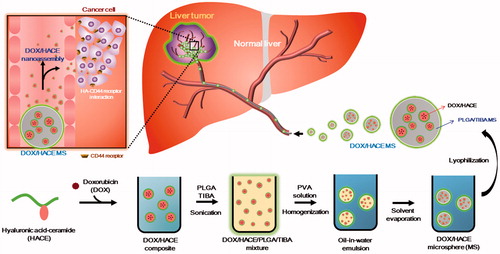
Figure 2. Particle characterization of DOX-loaded MS. (A) Size distribution profiles of DOX MS and DOX/HACE MS. (B) CLSM images of DOX MS and DOX/HACE MS. Depth-dependent cross-sectional images were observed by CLSM. Red fluorescence signal in MS indicates the intraparticle distribution of DOX. The length of the scale bar is 5 μm. (C) Particle characteristics of released DOX/HACE nanoassembly from DOX/HACE MS after incubating for 7 days. Size distribution profile (left) and TEM image (right) are presented. The length of the scale bar in the TEM image is 500 nm.
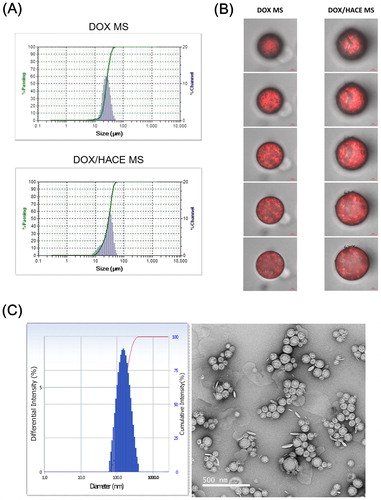
Figure 3. In vitro degradation test of fabricated MS. DOX MS (A) and DOX/HACE MS (B) were incubated in PBS (pH 7.4) and FBS for 14 days. The morphology of MS was observed by SEM (scale bar = 20 μm). Inset with the yellow boundary indicates the magnified image (scale bar = 2 μm).
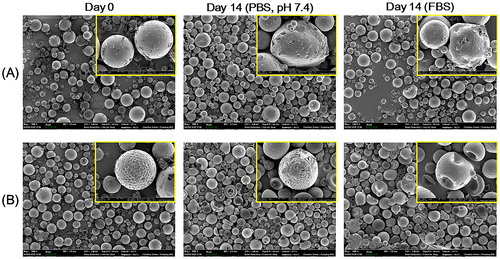
Figure 4. Drug release profiles from DOX MS (pH: 7.4) and DOX/HACE MS (pH: 7.4, 6.8, and 5.5). Each point indicates the mean ± SD (n = 3).
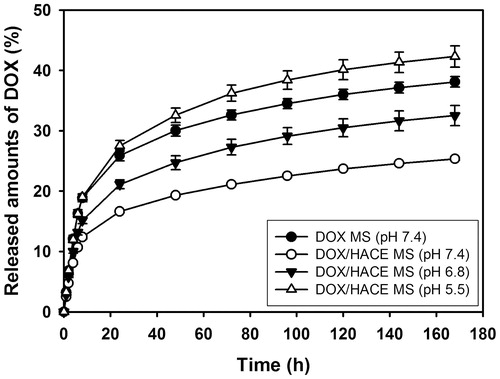
Figure 5. Cellular accumulation efficiency and in vitro anticancer activities in HepG2 and McA-RH7777 cells. (A) The mean fluorescence intensity values of DOX, measured by flow cytometry, in HepG2 cells and McA-RH7777 cells. Each point indicates the mean ± SD (n = 3). *p < .05, compared with DOX group. #p < .05, compared with DOX MS group. (B) Antiproliferation efficacy, evaluated by MTS-based assay, of DOX-loaded MSs in HepG2 cells and McA-RH7777 cells. Cell viability (%) is presented as the relative percentage based on the control (no treatment) group. Each point indicates the mean ± SD (n = 3). #p < .05, compared with DOX MS group. (C) Apoptotic efficacy of developed MS, measured by Annexin V and PI-based assays, in HepG2 cells and McA-RH7777 cells. UL, LL, LR, and UR indicate upper left, lower left, lower right, and upper right, respectively. Each point indicates the mean ± SD (n = 3). *p < .05, compared with DOX group. #p < .05, compared with DOX MS group.
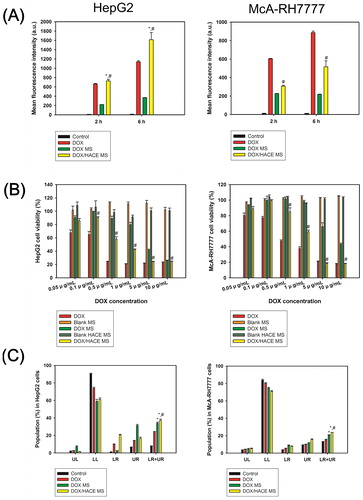
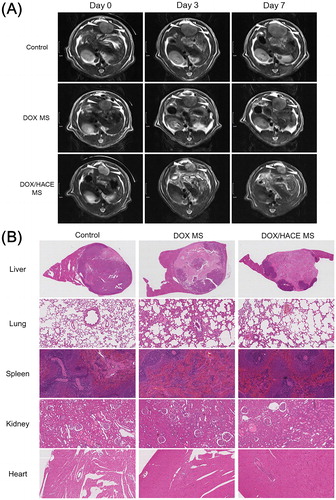
Figure 6. In vivo anticancer activities in the McA-RH7777 tumor-implanted rat model. (A) Serial MR images of liver tumors in control (sham operation), DOX MS, and DOX/HACE MS groups on day 0 (pre-treatment status), 3, and 7 after IA administration. White arrowheads in MR images indicate liver tumor. The length of scale bar in the left side is 1 cm. (B) H&E staining images of dissected liver and tumor, lung, spleen, kidney, and heart in control, DOX MS, and DOX/HACE MS groups. The length of scale bar (shown in the lower right side) in the images of lung, spleen, kidney, and heart is 100 μm.