Figures & data
Figure 1. Soluble expression and purification of rhFGF20. (A) Agarose gel electrophoresis showing the molecular weight of the insert DNA comprising the SUMO-rhFGF20 DNA sequence (lane a, lower band ∼1000 bp) and the backbone of pET20 expression vector (lane a, upper band >2000 bp). (B) SDS–PAGE gel showing expression of SUMO-rhFGF20. Lane M: protein molecular weight markers; lane a: bacterial lysate before IPTG induction; lane b: bacterial lysate after induction by 1 mM IPTG; lane c: soluble supernatant fraction after centrifugation; lane d: insoluble fraction of the bacterial lysate after low-speed centrifugation. (C) SDS–PAGE gel analysis for fractions from Ni–NTA agarose column. Lane M: protein molecular weight markers; lane a: loading sample; lane b: flow through; lane c: wash fraction; lane d: fraction eluted from Ni column. (D) Source Q purification following digestion by SUMO protease. Lane M: protein molecular weight markers; lane a: IMAC purified SUMO-rhFGF20; lane b: SUMO protease; lane c: sample after enzyme digestion; lane d: SUMO protease and SUMO eluted from Source Q column; lane e–g: purified rhFGF20. (E) Immunoblotting of the purified rhFGF20 detected using anti-human FGF20 antibody. Lane S: standard rhFGF20 sample; Lane e–g: purified rhFGF20.
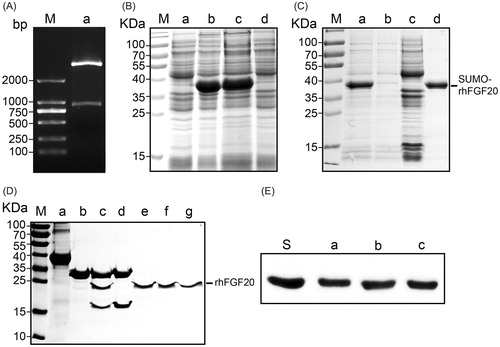
Figure 2. Activity assay of purified rhFGF20. (A) Mitogenic activity of rhFGF20 and rhFGF2 in NIH 3T3 cells. Purified rhFGF20-induced mitogenic response in NIH3T3 cells in a dose-dependent manner that was comparable to that of rhFGF2 with the curve saturating at 125 ng/ml. (B,C) Comparison of the effects of FGF20 and FGF2 on the viability of PC12 (B) and SHSY5Y (C) cells respectively. (D,E) Western blotting and semi-quantitative analysis of caspase-3 levels in PC-12 cell induced with 6-OHDA or 6-OHDA/rhFGF20. (F) Immunofluorescence staining of caspase-3 levels in PC-12 cell induced with 6-OHDA or 6-OHDA/rhFGF20. Scale bar = 75 μm. (G,H) Representative pictures of the TUNEL staining (apoptotic cells are indicated by yellow arrows). Quantitative analysis of the apoptotic cells. Scale bar = 50 μm. Data from three independent measurements are presented as mean ± SEM. **p < .01; ***p < .001 versus 6-OHDA group.
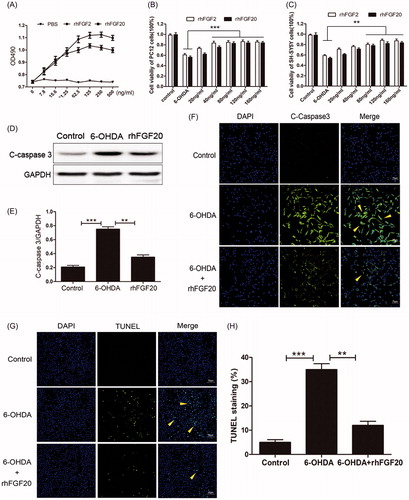
Figure 3. Characterization of LIP-rhFGF20. (A) Dosing diagram for FUS + LIP-rhFGF20. Normal saline or different proteins were injected once daily for 2 weeks into the tail vein. For FUS + LIP-rhFGF20 treatment, for each administration of LIP-rhFGF20, ultrasound was focused on the appropriate part of the brain of the mouse. (B) Morphology of LIP-rhFGF20 as analyzed by scanning electron microscopy (JEOLJEM-2000EX; JEOL, Tokyo, Japan) at 200 kV. (C) The particle size and distribution of LIP-rhFGF20 showing uniform distribution of 68.1 ± 2.1 nm (PDI = 0.144). (D) The in vitro release of rhFGF20 from LIP-rhFGF20 over a 24 h time period, showing purified rhFGF20 as control sample. (E) Determination of concentration of exogenous rhFGF-20 in the striata of 6-OHDA rats. The rhFGF-20 concentrations in striatal tissue of PD rats treated with FUS + LIP-rhFGF20, LIP-rhFGF20 and rhFGF20 were measured at 0, 15 and 30 min following treatment. Data from three independent measurements are presented as mean ± SEM. ***p < .001 versus rhFGF20 or LIP-rhFGF20.
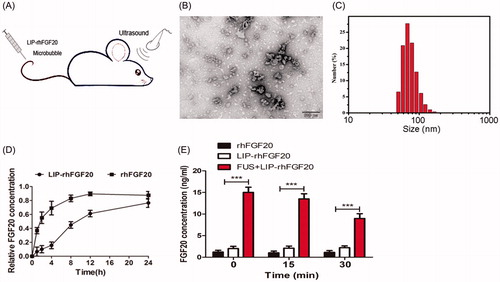
Figure 4. Effects of FUS + LIP-rhFGF20 on amphetamine-induced rotational behavior, and concentrations of monoamine neurotransmitters and their metabolites in the striatum of 6-OHDA-induced rat model of PD. (A) Effects of rhFGF20, LIP-rhFGF20, and FUS + LIP-rhFGF20 on apomorphine-induced rotational behavior: DA (B) and HVA/DOPAC (C) concentrations in striatum tissue were determined by HPLC-ECD. (D) Detection of tissue damage in striatum by HE staining after 2 weeks’ treatment. Scale bar =25 μm. Data are presented as mean ± SEM (n = 6). *p < .05; **p < .01; ***p < .001 versus 6-OHDA group; ###p < .001 versus sham rats.
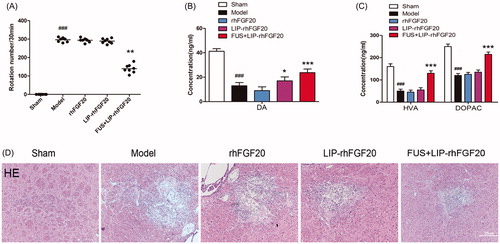
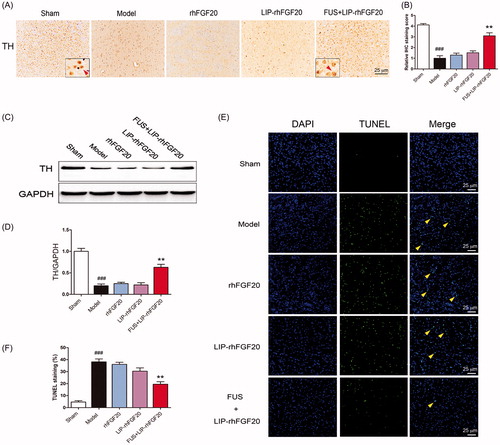
Figure 5. Impact of FUS + LIP-rhFGF20 on the dopaminergic neural loss in the striatum of 6-OHDA rats. (A) Immunohistochemistry assay using TH-antibody were carried out to detect the effects of FUS + LIP-rhFGF20, LIP-rhFGF20 and rhFGF20 on the levels of TH-positive dopaminergic neurons in SN tissues. Scale bar =25 µm. (B) Semi-quantitative analysis of TH immunohistochemistry observed in panel A. (C) Effect of FUS + LIP-rhFGF20, LIP-rhFGF20 and rhFGF20 treatment on the protein levels of TH in SN tissues. (D) Semi-quantitative analysis of the protein bands observed in panel C. (E,F) After 2 weeks’ treatment, analysis of the striatum tissue by TUNEL staining was performed to assess the effects of drugs on apoptosis. Representative pictures of the TUNEL staining (apoptotic cells are indicated by yellow arrows). Quantitative analysis of the apoptotic cells. Scale bar = 25 μm. All data in this figure from three independent measurements are presented as mean ± SEM. **p < .01 versus 6-OHDA group; ###p < .001 versus sham rats.