Figures & data
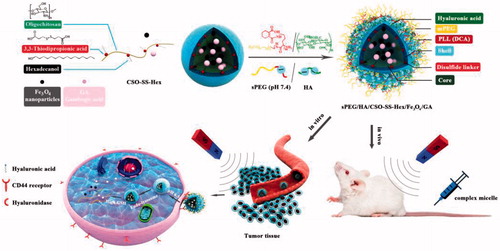
Scheme 1. Scheme of sPEG/HA/CSO-SS-Hex/Fe3O4/GA micelle construction and magnetism-enhanced EPR trafficking pathway. The cellular trafficking pathway includes receptor-meditated cellular internalization, redox and pH triggered micelle disassembly and drug release.
Scheme 2. Synthesis route of sPEG copolymer.
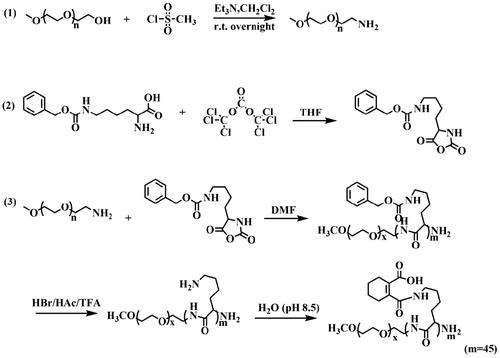
Figure 1. Characterization of sPEG/HA/CSO-SS-Hex/Fe3O4/GA micelles. (A) Size distribution and TEM of the micelles in water. (B) and (C) zeta potential and TEM of the micelles at pH 7.4 or pH 6.5 ± 10 mM GSH at 37 °C for 1 h and 2 h. (D) The stability of the micelles in PBS and FBS at 37 °C.
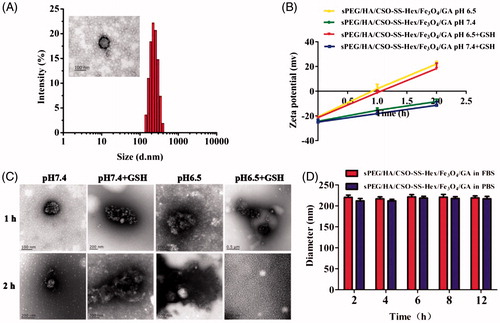
Figure 2. In vitro GA release and magnetic properties of sPEG/HA/CSO-SS-Hex/Fe3O4/GA micelles. (A) In vitro release profiles of GA from sPEG/HA/CSO-SS-Hex/Fe3O4/GA micelles under different simulated conditions at 37 °C (The error bars in the graph represent standard deviation (n = 3)). (B) Hysteresis loops of Fe3O4 nanoparticles and sPEG/HA/CSO-SS-Hex/Fe3O4/GA micelles solution. (C and D) refer to the Fe3O4 nanoparticles chloroform solution and sPEG/HA/CSO-SS-Hex/Fe3O4/GA micelles water solution of (a) before, (b) after imposing an external magnetic field and (c) removal of magnetic fields.
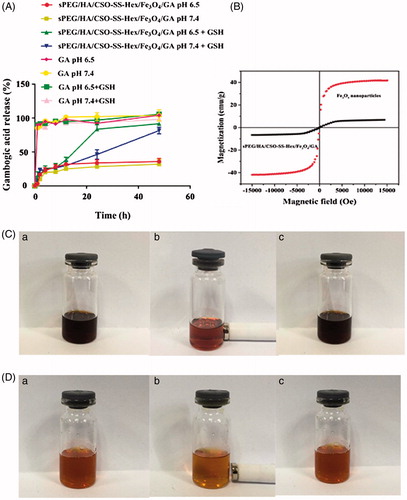
Figure 3. Cell uptake and intracellular drug release of complex micelles in 4T1 cells. (A) 4T1 cells were incubated with FITC and NR-loaded sPEG/HA/CSO-SS-Hex/Fe3O4, HA/CSO-SS-Hex/Fe3O4 and CSO-SS-Hex/Fe3O4 at different condition for 2 h, and labeled with DAPI (blue) to identify cell nuclei. The bar shown is 20 μm. (B) Quantitative determination of FITC by flow cytometry after 4T1 cells were incubated with FITC-sPEG/HA/CSO-SS-Hex/Fe3O4/GA micelles at pH 6.5 or 7.4, FITC-HA/CSO-SS-Hex/Fe3O4/GA and FITC-CSO-SS-Hex/Fe3O4/GA for 2, 4, 6, 8 h. (C) Micrographs of sPEG/HA/CSO-SS-Hex/Fe3O4/GA micelles after 3 h incubation in an external magnetic field, (a and b) refer to nile red fluorescent intensity of cells located in circle 1 and circle 2; (c and d) refer to Prussian blue staining of cells located in circle 1 and circle 2. Circle 1 indicates magnet position (targeted area), whereas circle 2 indicates an area with weaker magnetic field strength (control area). The bar shown is 50 μm.
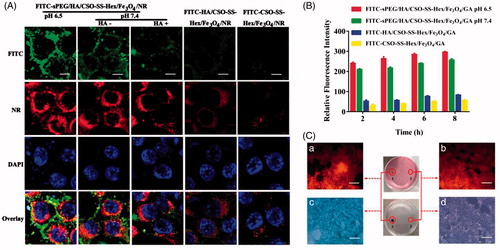
Figure 4. Pharmacodynamics evaluation of sPEG/HA/CSO-SS-Hex/Fe3O4/GA in vivo. (A) Mean blood concentration–time curve of Sprague Dawley female rats after caudal vein administration of sPEG/HA/CSO-SS-Hex/Fe3O4/GA micelles and free GA (Each value represents the mean ± SD, n = 6). (B and C) In vivo fluorescence images of tumor-bearing mice acquired after injecting DiR-conjugated sPEG/HA/CSO-SS-Hex/Fe3O4/DiR micelles suspensions, it showed the tumor not exposing (MF-) or exposing (MF+) to magnetic fields at 24 h (B), while (C) showed the tumor exposing to magnetic fields at different time points (the red circle indicates an area of tumor position).
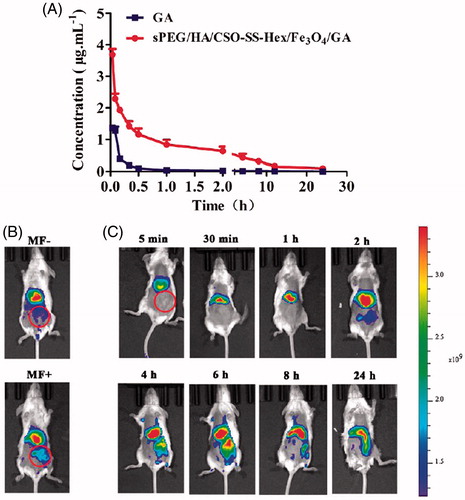
Figure 5. In vivo anti-tumor effect of sPEG/HA/CSO-SS-Hex/Fe3O4/GA. (A) Change of tumor volume in 4T1 cell-bearing mice after intravenous injection of different formulations. The two groups of GA and sPEG/HA/CSO-SS-Hex/Fe3O4/GA all showed the extremely significant difference (p < 0.01) vs. saline control. (B) Change of body weight in 4T1-bearing mice during the study. (C) Images of excised tumors of all groups at the end of study. (11 days post the initiation of treatment). Points are presented as mean ± SEM (n = 6).
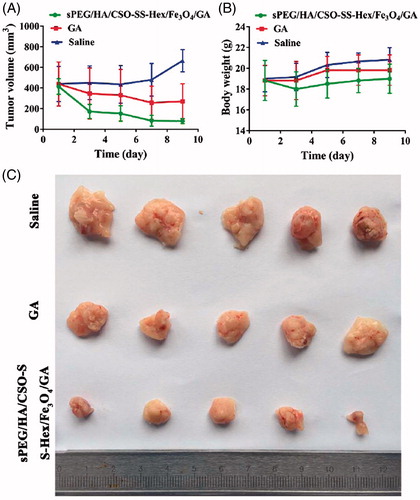
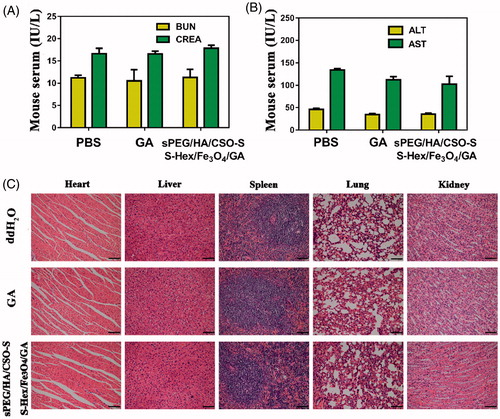
Figure 6. Biosafety of sPEG/HA/CSO-SS-Hex/Fe3O4/GA micelles in vivo. (A) Serum levels of BUN and CRE (renal function) at 48 h after last treatment. (B) Serum levels of ALT and AST (liver function) at 24 h after last treatment. (C) H&E staining of female rat organs (hearts, livers, spleens, lungs, and kidneys) at the end of experiments. The bar shown is 50 μm.