Figures & data
Figure 1. Sketch of drug loading for DEX and DNR. The first step demonstrates a NH2 functionalized pSi surface (left sketch) and the second step is showing a COOH terminated pSi surface (middle sketch). The third step demonstrates the conjugation of DEX and DNR to the pSi surface via ester (carbon–oxygen) bond or amide (carbon–nitrogen bond) (right sketch).
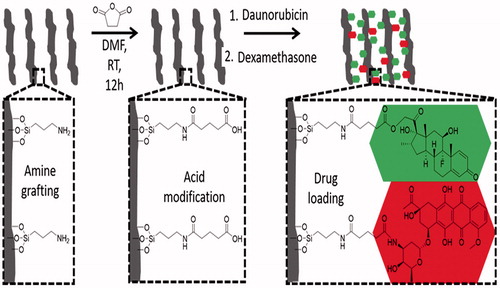
Table 1. Drug loading parameters.
Figure 2. Dex and DNR concentration-time curves from in vitro release. The Y axis is in natural log scale. Dex: dexamethasone; DNR: daunorubicin.
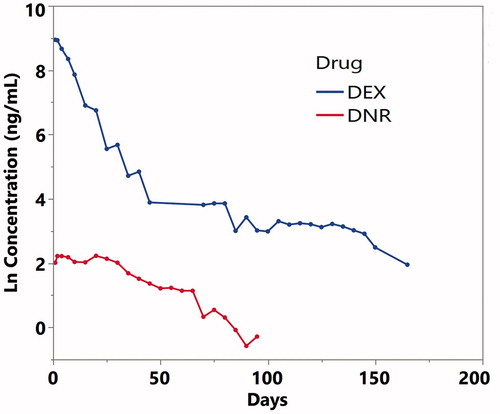
Table 2. In Vitro release kinetics and predicted parameters.
Figure 3. Images of the fundus and injected particles. The left column shows the optic nerve and visual streak. The right column displays the inferior view of the fundus. The injected particles appeared reddish due to the color of DNR (arrows) and aggregated into the inferior vitreous cavity (arrow heads) within a few days after the injection. Fundus photographs at all-time points showed clear vitreous and normal retina.
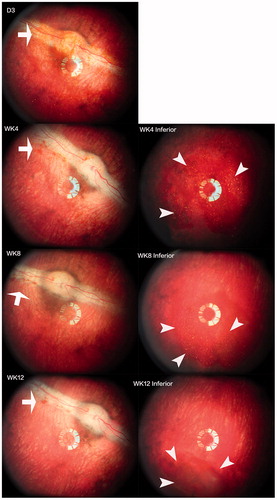
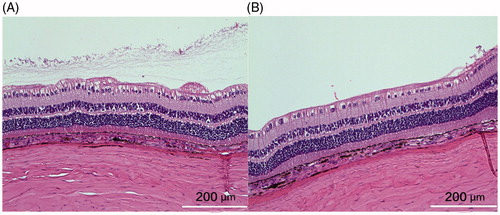
Figure 4. The left panel was from the control eye and the right panel from the study eye. Both sections were from similar location in relation to the visual streak. The structure of the retina appeared normal and comparable though the section from the control eye may be closer to medullary ray, showing more radiating myelinated nerve fibers on the inner surface of the retina. The cortical vitreous collagen can be seen in the vitreous near the retina of the control eye. The white bar =200 µm.