Figures & data
Figure 1. Schematic illustration of the formation of HSA-PEG/PTX nanoparticles.
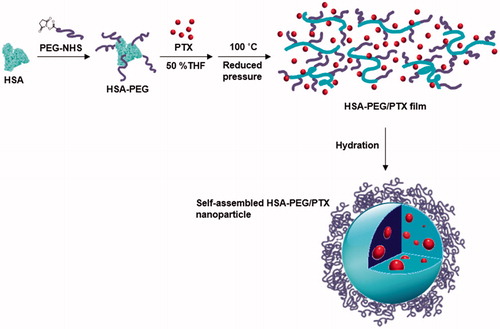
Figure 2. Characterization of the HSA-PEG conjugate. (a) SDS-PAGE. (b) HPLC analysis. (c) Size distribution and morphology of HSA-PEG/PTX determined by the light scattering method and electron microscopy (upper insets: TEM image; lower inset: SEM image). (d) Nile red inclusion assay for the observation of the localization of the hydrophobic model dye, nile red, in HSA-PEG/PTX.
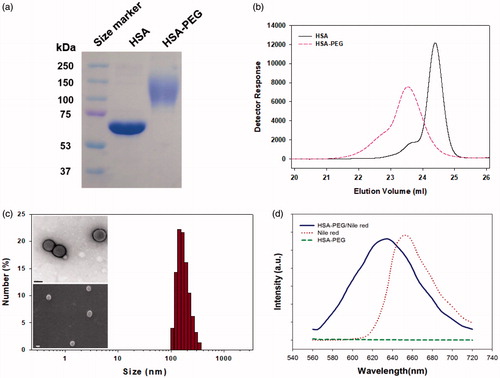
Figure 3. Cumulative release of PTX from HSA-PEG/PTX and dissolution of PTX powder suspension in an aqueous solution. The release experiment was carried out in the presence of 1.0 M sodium salicylate as a hydrotropic agent.
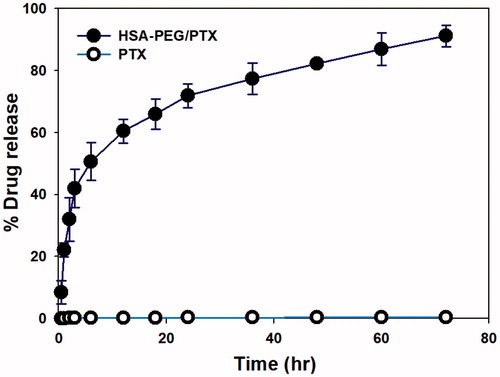
Figure 4. Cellular uptake of HSA-PEG/DiIC18 in SK-BR-3cells. The images were obtained by a confocal laser scanning microscope 4 h after the treatment of HSA-PEG/DiIC18. (a) DAPI (blue), (b) DiIC18 (red), (c) differential interference contrast (DIC) image, (d) merged image, and (e) merged image with orthogonal z-stack projection.
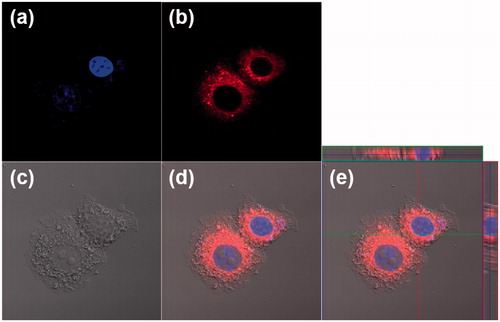
Figure 5. Cytotoxicity of HSA-PEG/PTX in various human breast cancer cells. Cell viability was determined by MTT assays after 24 h (a–c) and 72 h (d–f) incubation with the indicated formulation. (a, d) Cytotoxicity of HSA-PEG/PTX in SK-BR-3 cells. (b, e) Cytotoxicity of HSA-PEG/PTX in MDA-MB-453 cells. (c,f) Cytotoxicity of HSA-PEG/PTX in MCF-7 cells. HSA-PEG, PTX dissolved in DMSO and Abraxane® were used as controls.
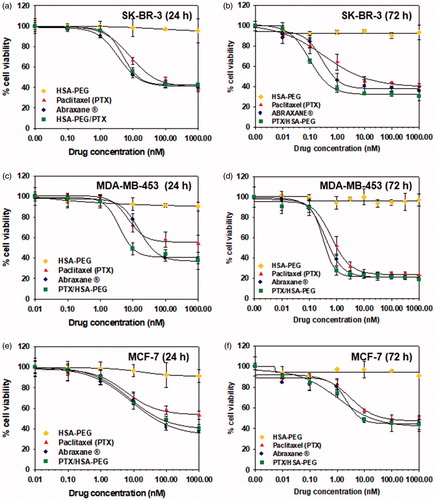
Figure 6. Inhibition of tumor growth by HSA-PEG/PTX in an animal tumor model. (a) Inhibition of SK-BR-3 tumor growth by HSA-PEG/PTX. One hundred microliters of the desired formulations were systemically administered to tumor-bearing mice on days 0, 3, 5, 7, and 9. Tumor growth was monitored by measuring tumor volume as described in the Materials and methods section and expressed as a percent of the initial volume (100 mm2). The dose of PTX was 4 mg/kg. The results are presented as mean ± SD (n = 8/group). *p < .01 versus controls. (b) Mouse survival rate after the systemic administration of PTX, Abraxane®, and HSA-PEG/PTX.
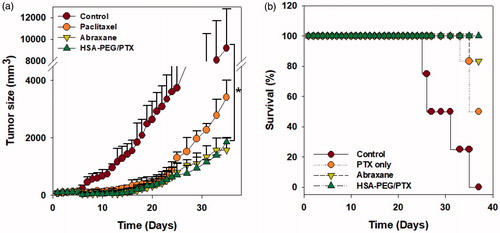
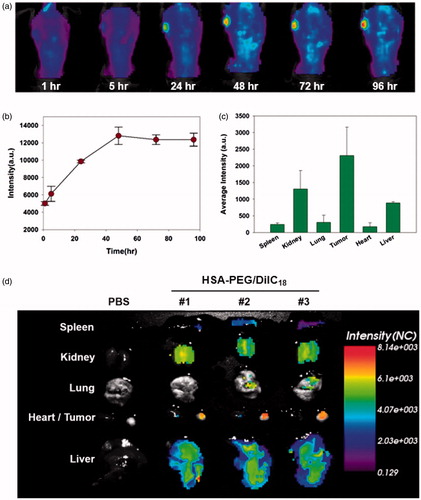
Figure 7. In vivo biodistribution of HSA-PEG/DiIC18 nanoparticles. (a) Extended systemic circulation and tumor accumulation of HSA-PEG/DiIC18 after IV injection through the tail vein. The image was obtained by in situ whole body fluorescence imaging, and the tumor accumulation profile was analyzed using OptiView® software (b). (c) In vivo biodistribution of HSA-PEG/DiIC18 nanoparticles in the major organs. The average fluorescence intensity of each organ was obtained from ex vivo biodistribution images shown in (d) and represented as mean ± SD (n = 3).