Figures & data
Figure 1. Voriconazole liposomal formulation characteristics. TEM micrograph of empty (blank) liposomes (A,B); VCZ liposomes (LVCZ) (C,D); VCZ liposomes (LVCZ) size distribution profiles by intensity obtained by DLS from three independent batches (E); freeze-dried formulation (F); redispersed freeze-dried LVCZ in a transparent infusion bag (G); and representative chromatogram from VCZ liposomal formulation at 2.0 mg/mL by HPLC with UV–VIS detector (H).
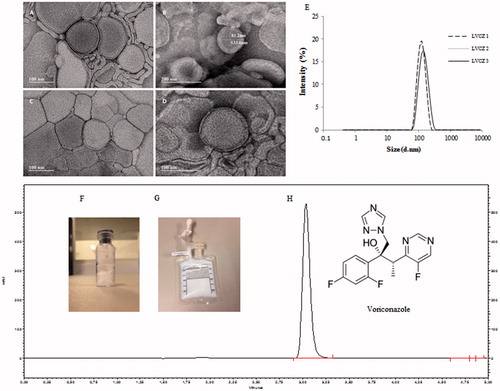
Table 1. Minimum inhibitory (MIC) and fungicide (MFC) concentrations (μg/mL) of voriconazole and liposomal voriconazole on Candida species sp. and Aspergillus sp.
Figure 2. HPLC-MS/MS and analytical conditions. Full scan mass spectrum of (A) voriconazole and (B) voriconazole N-oxide by electrospray ionization in positive mode of the transitions of m/z 350.2/127.0 and m/z 366.2/224.2, respectively. Chromatographic profiles obtained under following conditions: ACE C18 column (100 × 4.6 mm ×5 µm), at 20 °C; mobile phase consisted of formic acid at 0.025% + ammonium acetate 2 mM and acetonitrile (25:75 v/v), flow rate of 1.0 mL/min. Run time was 2.0 min, and the injection volume was 5.0 µL, with an elution time for VCZ and VNO of 1.43 and 1.19 min, respectively. Calibration curves, ranging 5–5000 and 20–5000 ng/mL for VCZ (C) and VNO (D), respectively.
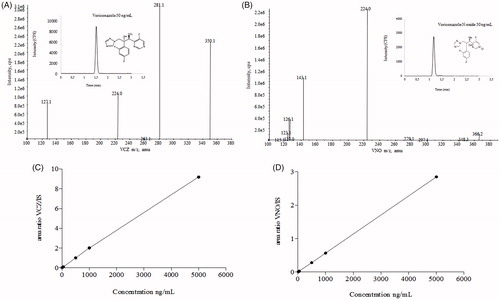
Table 2. Pharmacokinetic and pharmacodynamic parameters after 10 mg/kg IV administration of two different voriconazole formulations to Balb/c mice.
Figure 3. Pharmacokinetic and biodistribution profile of voriconazole from two different formulations. (A) Blood levels of intravenously injected voriconazole versus time 0–24 h (AUC0–24) delivered from liposomal formulation (circles) and VFEND® (squares) at 10 mg/kg. (B) Concentrations versus time of the metabolite (voriconazole-N-oxide) measured within the hour following intravenous administration of the formulations. Data are expressed as mean ± SD (n = 12 animals per group). (C) Tissue distribution of voriconazole 4 h after I.V. administration of liposomal formulation (white bars) and voriconazole complexed in sulfobutyl ether-beta-cyclodextrin so + dium, commercially available as VFEND® (black bars). Bars represent the standard deviation (n = 6). (*indicates p<.05).
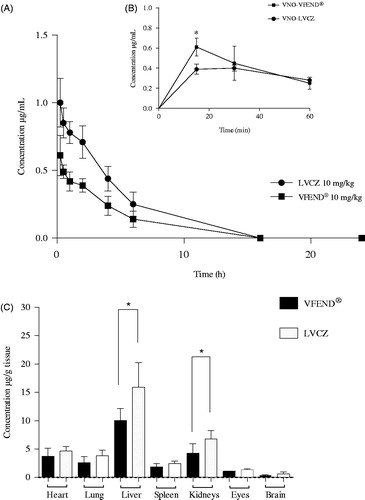
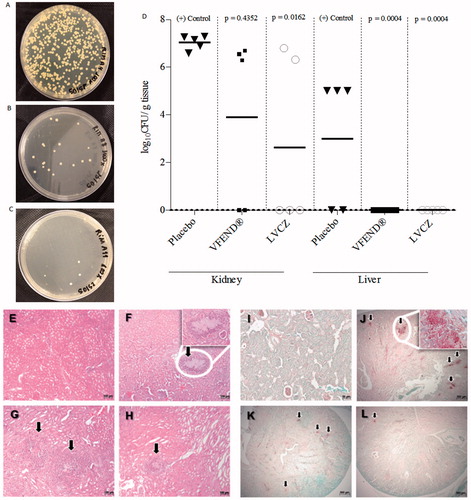
Figure 4. Fungal growth of C. albicans from kidneys of imunossupressed and infected mice treated with placebo (A), VFEND® (B) and LVCZ (C). (D) Effects of the VCZ treatments on the tissue burden of C. albicans in infected mice and controls (n = 5 per group). Infection was completely resolved in the liver using VFEND® or LVCZ formulation. Representative micrographs of histological analysis of H&E stained kidney sections of (E) control group, healthy Balb/C mice, (F) infected mice, placebo group, (G) infected mice, treated with VFEND® and (H) infected mice, treated with LVCZ. PAS stained kidney sections showing fungal invasion in (I) control group, healthy Balb/C mice, (J) infected mice, placebo group, (K) infected mice, treated with VFEND® and (L) infected mice, treated with LVCZ. Inserts are higher magnification of fungal invasion areas in the kidney tissue, also indicated by black arrows.