Figures & data
Table 1. Composition, entrapment efficiency, and vesicle size of SSG-NDLs.
Figure 1. (a) In vitro drug release study in PBS (pH 7.4) and sodium acetate (pH 5.5) buffers. (b) Ex vivo permeation study in PBS of pH 7.4. (c) Histopathological study of the skin patch treated with plain SSG, showing gaps and slight distorted skin layers. (d) Comparison of SSG percentage permeated and SSG retention in the stratum corneum and epidermis/dermis layers of the skin treated with plain SSG, SSG-NDLs, and SSG-NDLs gel.
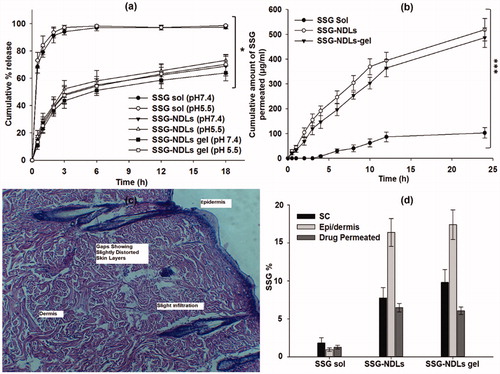
Figure 2. (a) Images observed under normal light microscope (A and B) and corresponding fluorescent microscope (C and D) of normal (A and C) skin and FITC/SSG-NDLs treated (B and D) skin sections after 24 h topical application. (b) FTIR spectra and DSC thermogram of untreated and SSG-NDLs gel treated epidermis. (c) Hematoxylin and eosin stained cross sectional images of different skin sections of (i) blank group, (ii) formalin (0.8%), and (iii) SSG-NDLs gel groups.
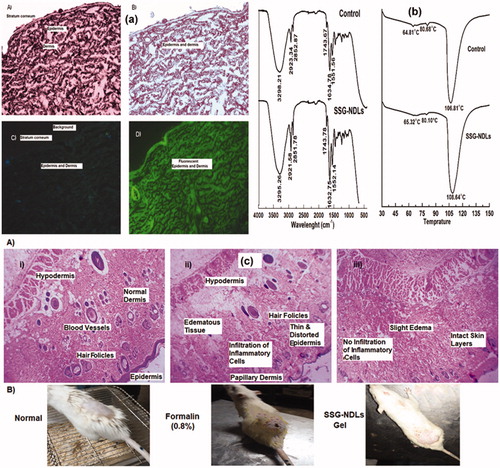
Table 2. Storage stability of dialyzed and un-dialyzed SSG-NDLs and SSG-NDLs gel for 60 days.
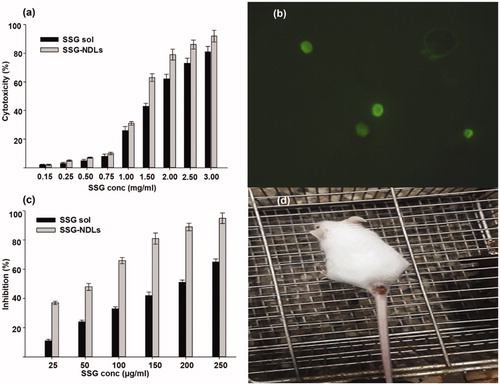
Figure 3. (a) Cytotoxicity potential of SSG solution and SSG-NDLs on the mice peritoneal macrophages. (b) Uptake of FITC/SSG-NDLs in mice peritoneal macrophages after 30 min incubation. (c) Inhibitory effect of different concentrations of SSG solution and SSG-NDLs on amastigote growth. (d) In vivo BALB/c infection model of cutaneous leishmaniasis.