Figures & data
Table 1. Single factor study of TBE-loaded P-NPs obtained under different conditions.
Table 2. Characterization of TBE-loaded NPs.
Figure 1. In vitro TBE release profiles of free TBE, P-TBE-NPs, T/P-TBE-NPs, and anti-EPHA3-T/P-TBE-NPs.
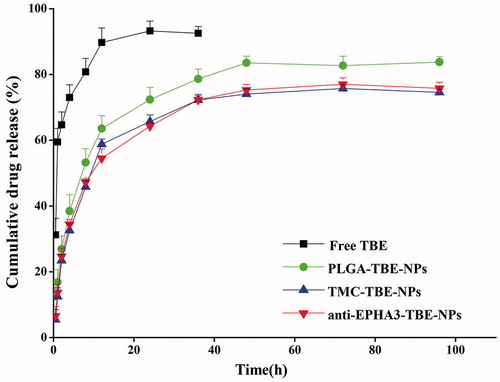
Figure 2. (A) Fluorescence microscopy images of C6 cells incubated with Nile red-loaded NPs. (B) Mean percentages of coumarin-6 NP uptake by C6 cells, as determined by flow cytometry. Values represent the mean ± SD (n = 3). **p < .01 versus P-NPs; ##p < .01 versus T/P-NPs. NPs: nanoparticles.
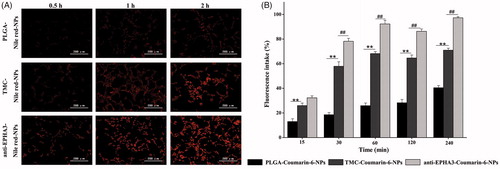
Figure 3. In vivo and brain distribution of DiR- and coumarin-6-loaded NPs in glioma-bearing rats. (A) In vivo fluorescence imaging at predetermined time points after intranasal administration of DiR-loaded NPs. (B) In vivo and excised tissues imaging of anti-EPHA3-modified DiR-loaded NPs at 4 h after intranasal and intravenous administration. (C) Fluorescence microscopy images of the brain, acquired 4 h after intranasal administration of coumarin-6-loaded NPs to glioma-bearing rats. Green: coumarin-6; blue: Hoechst 33342 (nuclei); yellow arrows point to the tumor site. DiR, 1,-1-dioctadecyl-3,-3,-3′,-3′-tetramethylindotricarbocyanine; NPs: nanoparticles.
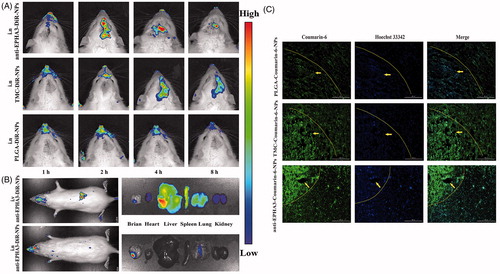
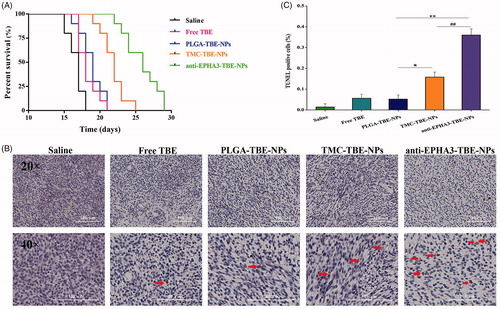
Figure 4. Effects of treatments with TBE-loaded NPs on glioma-bearing rats. (A) Survival curves of glioma-bearing rats after different treatments (n = 10 each). (B) Apoptosis of glioma cells in glioma-bearing rats treated with saline, free TBE, P-TBE-NPs, T/P-TBE-NPs, and anti-EPHA3-T/P-TBE-NPs. Brown: apoptotic tumor cells; blue: tumor cells; red arrows point to apoptotic cells. (C) Quantification of apoptosis in rats treated with different formulations. Values represent the mean ± SD (n = 3). *p < .05 and **p < .01 versus P-TBE-NPs; #p < .05 versus T/P-TBE-NPs. NPs: nanoparticles; TBE: temozolomide butyl ester.