Figures & data
Figure 1. The morphology of GEM-Lip powder shown in the inset SEM images (A). Structure of GEM-loaded liposomes was shown in the TEM images in (B). The size distribution of GEM-Lip (C). Zeta potential (D). Annotation for y-coordinate was displayed in an inappropriate line (E). The mechanism of crosslinking (F). The appearance of GelMA and GEM-Lip@Gel with different content of liposome (G).
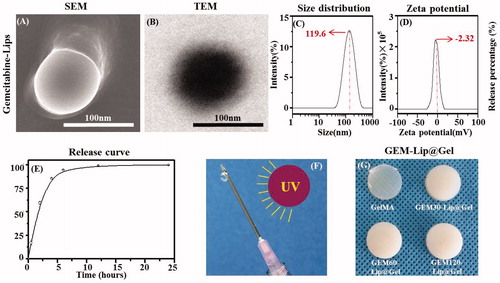
Figure 2. The morphology of GelMA and GEM-Lip@Gel with different quantities of liposome contents were shown in the inset SEM images in (A). The magnification of the selected area in (B). The statistics of distribution of pore size in (C).
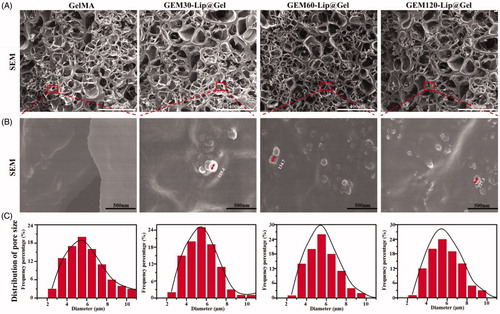
Figure 3. The mechanical investigation on GelMA hydrogel and GEM-Lip@Gel with different quantities of liposome contents. The compression experiments of GelMA hydrogel and GEM-Lip@Gel: (A) stress, (B) compression modulus, (C) percentage of compression, and (D) resistance force.
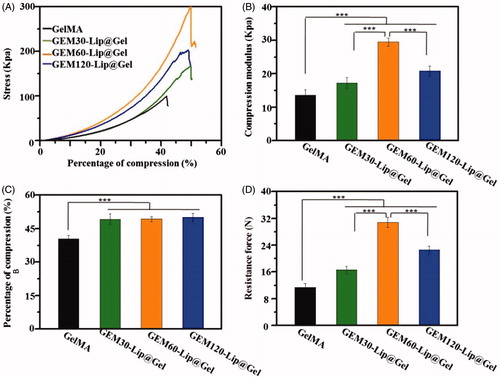
Figure 4. Physical characterizations of GelMA and GEM-Lip@Gel with different quantities of liposome contents. Swelling percentage (A). Degradation profiles (B).
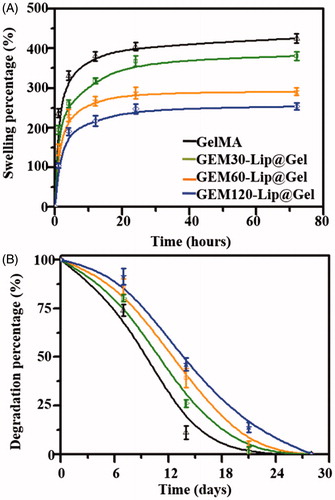
Figure 5. The drug release profile of GEM in GelMA and GEM-Lip@Gel with the different quantities of GEM-Lip contents at GelMA concentration of 20% (A), and at GelMA concentration of 10% (B).
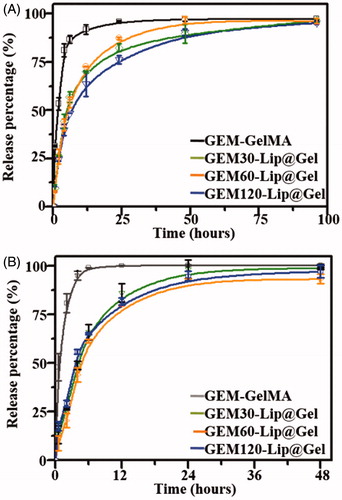
Figure 6. The result of CCK-8 and live/dead stain, MG63 cells were cultured with different lixivium from GEM-GelMA and GEM-Lip@Gel. The lixivium from first 4 hours, Stage 1 (A). 4–24 h, Stage 2 (B). 24–96 h, Stage 3 (C).
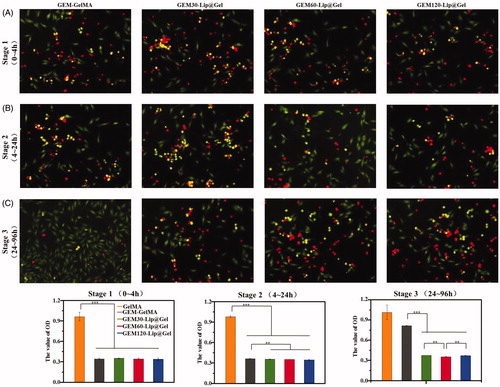
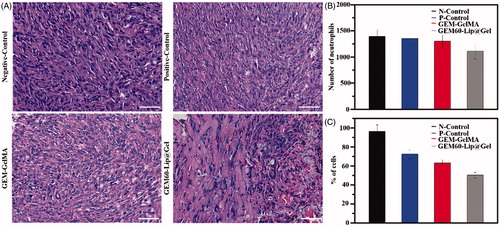
Figure 7. In vivo anticancer efficiency of GEM-GelMA and GEM-Lip@Gel hydrogel. H&E stained images (A). The number of neutrophils (B). The percentage of MG63 cells (C).