Figures & data
Table 1. Independent variables with the respective levels investigated in the 31.22 mixed factorial design and the dependent variables with their required constraints, together with the detailed Composition of the prepared STZ-MMs formulations and their characterization.
Table 2. Significance of different model terms appearing in the final model for each response, together with models evaluation.
Figure 1. (I) line plots of the significant effects of type of auxiliary surfactant, total surfactants: drug ratio and type of penetration enhancer on (A) SM, (B) PS, (C) PDI, and (D) ZP. (II) DSC thermograms of STZ, HS15, B58, MM-8 physical mix., plain MM-8, STZ-MM-8, MM-11 physical mix., plain MM-11, and STZ-MM-11.
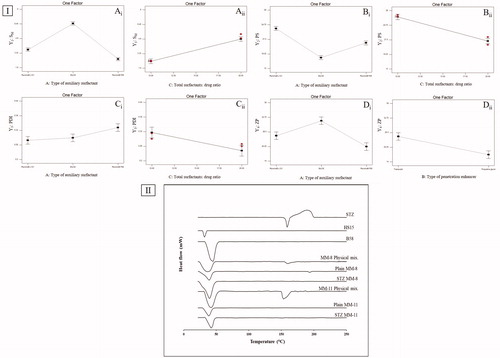
Table 3. Predicted values of different responses for optimized formulations (MM-8 and MM-11) compared to the actual values together with the prediction intervals and percent deviations.
Figure 2. (I) Mucoadhesion results: (A) PS measurements, (B) ZP measurements and (C) Turbidimetric measurements. (II) Evolution of the absorbance of optimized formulations (MM-8 and MM-11) after 100-folds dilution in STF. (III) The ex-vivo permeation profile of STZ from optimized formulations (MM-8 and MM-11) compared to the STZ-suspension.
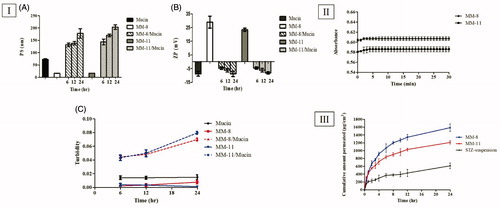
Table 4. Effect of storage on the physicochemical properties of optimized STZ-MMs formulations (MM-8 and MM-11).
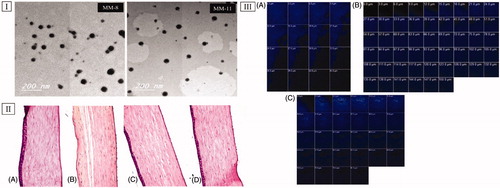
Figure 3. (I) Transmission electron micrographs of optimized formulations (MM-8 and MM-11). (II) Photomicrographs of the rabbits’ corneas after instillation of; (A) normal saline solution (negative control), (B) Isopropyl alcohol (positive control), (C) MM-8 formulation and (D) MM-11 formulation. (III) Confocal laser scanning micrographs of the rabbits’ corneas after instillation of (A) 0.1% RhB aqueous solution, (B) RhB loaded MM-8, and (C) RhB loaded MM-11.