Figures & data
Figure 1. SFN release profile from LNCs in DPBS (n = 4).
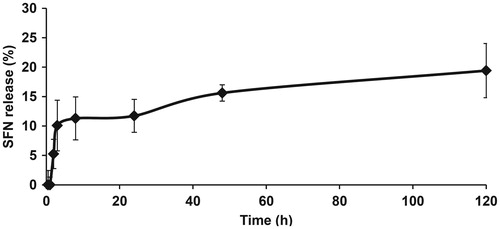
Table 1. Solubility of SFN in various excipients at 1% (w/w).
Table 2. Characterization of B-LNCs (n = 6) and SFN-LNCs (n = 17).
Figure 2: Effect of SFN-LNCs on U87MG tumor cell viability and the ability of HUVECs to form tube-like structures. (a) U87MG cell viability following exposure to various concentrations of B-LNCs, SFN-LNCs, or SFN (0.001–100 μM). Data are expressed as the means ± SEM (n = 4). The results obtained for U87MG cells grown in culture medium alone were considered to correspond to 100% survival (*p < .05 for B-LNCs, SFN-LNCs, or SFN vs. culture medium alone, Mann-Whitney U-test). (b and c) Formation of tube-like structures by HUVEC following treatment with B-LNCs, SFN-LNCs, or SFN (5 or 10 μM). (b) Angiogenesis was quantified by manually counting the number of tube-like structures. Results are presented as means ± SEM. The number of tube-like structures obtained in EGM-2 alone was considered to correspond to 100% (*p < .05 for SFN-LNCs or SFN vs. EGM-2, Mann–Whitney U-test). (c) Representative phase-contrast micrographs of HUVEC tube formation on Matrigel 16 h after treatment with 5 µM B-LNCs, SFN-LNCs, or SFN. The positive control corresponded to EGM-2 medium alone (scale bar = 100 µm).
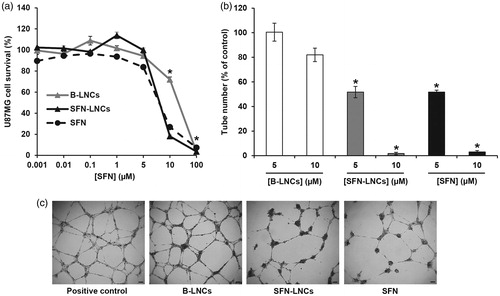
Figure 3. Effect of SFN-LNCs on tumor volume and perfusion in U87MG-bearing mice 4 days after treatment (D13). (a) Tumor volume distribution in each group, calculated from MRI images. (b) Perfusion MRI images of B-LNC- and SFN-LNC-treated U87MG glioma-bearing mice (scale bar = 1 mm). T2-weighted morphological images are shown in the top panels (i) and perfusion maps in the bottom panels (ii). (c) Graph showing blood-flow values in the tumor core, the surrounding tissue, and the contralateral striatum. Blood flow (mL/100 g/min) was measured by the ASL perfusion MRI method (*p <.05 for SFN-LNCs vs. HBSS, one-way ANOVA followed by Dunnett’s post hoc test for multiple comparisons).
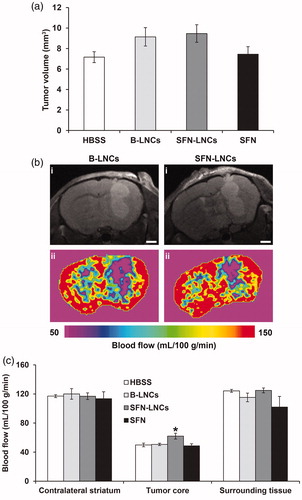
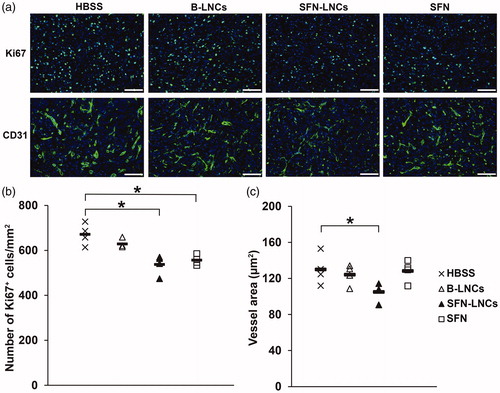
Figure 4. Effect of SFN-LNCs on Ki67+ cell number and CD31+ vessel area. (a) Immunofluorescence staining for Ki67 and CD31 in the tumor on day 16 in each group of animals (scale bar = 100 μm). (b and c) Quantitative results for Ki67 and CD31 immunofluorescence. Results are expressed as the mean number of Ki67+ cells per mm2 ± SEM (b) or CD31+ vessel area ± SEM (c) (*p < .05 vs. HBSS, one-way ANOVA followed by Dunnett’s post hoc test for multiple comparisons).