Figures & data
Figure 1. Preparation and characterization of nanoparticles. (A) Scheme of fabrication of CD-NP-PTX (a) and targeting delivery of drugs to tumor site (b). (B) TEM images of different nanoparticles. (C) Size distribution of nanoparticles determined by the DLS analysis. Bar =100 nm.
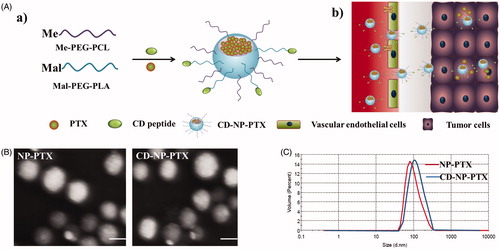
Figure 2. (A) Stability investigation of nanoparticles in vitro with the DMEM containing 20% FBS acting as the medium. (B) Drug release profiles of NP-PTX and CD-NP-PTX with the Taxol® as the control group. (C) In vitro investigation of the coumarine-6 release behavior from NP-C6 and CD-NP-C6.
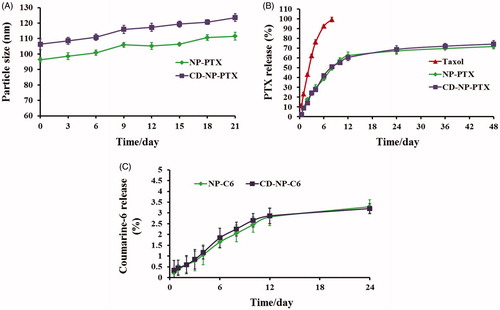
Figure 3. Cellular association of nanoparticles in vitro with the coumarin-6 acting as the fluorescence probe. (A) Qualitative images of cells obtained by the fluorescence microscope after incubated cells with different nanoparticles. (B) Quantitative analysis of HUVEC cellular uptake of various nanoparticles post 1 h of incubation. (C) Quantitative analysis of C6 cellular uptake of various nanoparticles post 1 h of incubation. ###p < .001 significantly higher than the cellular uptake of unmodified NP-C6.
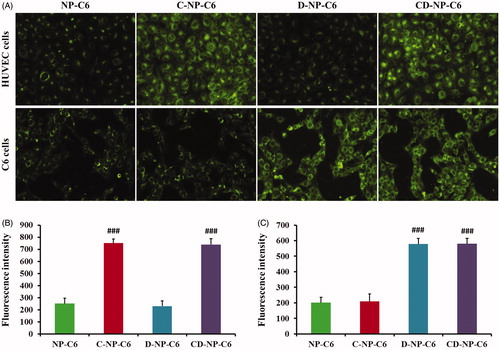
Figure 4. (A) Cytotoxicity of Taxol®, NP-PTX, C-NP-PTX, D-NP-PTX, and CD-NP-PTX against C6 cells in vitro after 48 h of incubation. Investigate the angiogenesis inhibition of different PTX formulations by the tube formation method. Quantitative (B) and qualitative (C) analysis of tube networks after treated with Taxol®, NP-PTX, C-NP-PTX, D-NP-PTX, and CD-NP-PTX, respectively, at the PTX concentration of 10 nM. The drug-free DMEM treated group was served as the control.
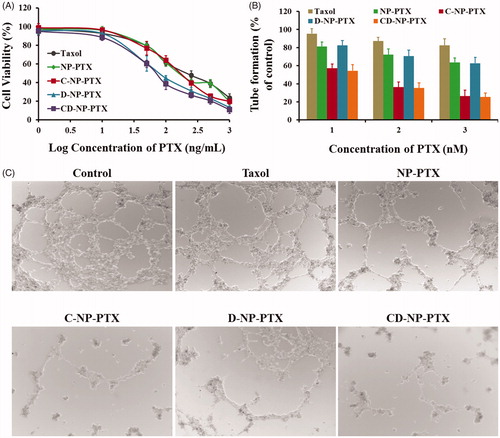
Figure 5. (A) In vivo biodistribution of DiR-labeled nanoparticles in glioma-bearing mice. (B) Ex vivo optical images of dissected tumors and main organs at 24 h post injection. (C) Semiquantitative analyzing the distribution of nanoparticles in various organs and tumors. (D) Evaluation of tumor targeting effect by study the distribution of nanoparticles in tumor site. Blue are the DAPI stained cell nuclei and green represented the coumarin-6-labeled nanoparticles.
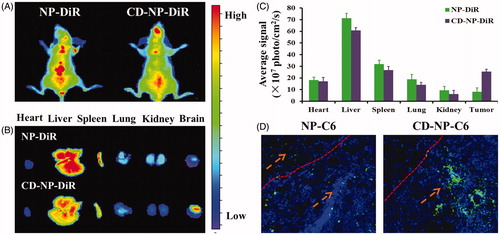
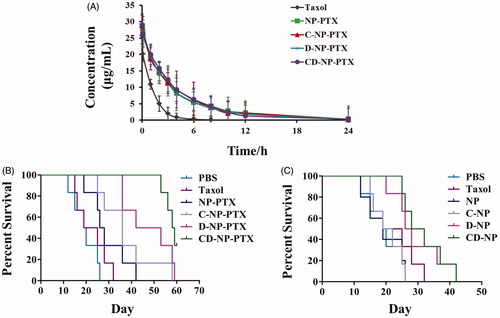
Figure 6. (A) Pharmacokinetic study of different PTX formulations in vivo. (B) Kaplane Meier survival curve of mice bearing glioma treated with PBS, Taxol®, NP-PTX and C-NP-PTX, D-NP-PTX, and CD-NP-PTX, respectively at PTX dose of 5 mg/kg (n = 6). (C) Evaluation of immunotherapy effect of DPPA-1 peptide by investigating the survival time of glioma-bearing mice post treat with different nanoparticles (n = 6).