Figures & data
Figure 1. Micelles (PEO-PCL 5-4) and polymersomes (PEO-PCL 5-11) size and charge characterizations: Transmission electron microscopy (A,B); DLS analyses (C); nanoparticle tracking analyses (D); and UV-vis analyses (E).
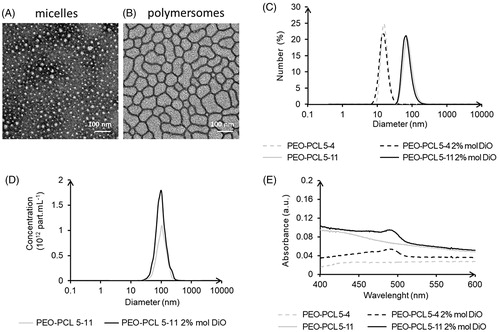
Table 1. Micelles and polymersomes physicochemical analysis: DLS hydrodynamic diameter (DH) in number and intensity average, NTA hydrodynamic diameter, and Zeta potential measurements.
Figure 2. Quantification by flow cytometry of internalization of micelles and polymersomes charged with DiO in HUVEC and HCT-116: kinetics in monoculture (A,B) and 24 h internalization in co-culture (C,D).
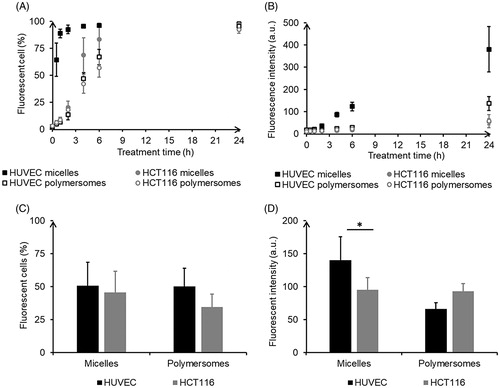
Figure 3. DiO penetration in 3D tumor spheroid depending on the nanocarriers: two-photon microscopy images of the mean intensity projection of DiO fluorescence from HCT-116 spheroids exposed for 24 h to micelles (A) and polymersomes (B). C and D are optical sections at z = 50 µm depth of the spheroid A and B, respectively.
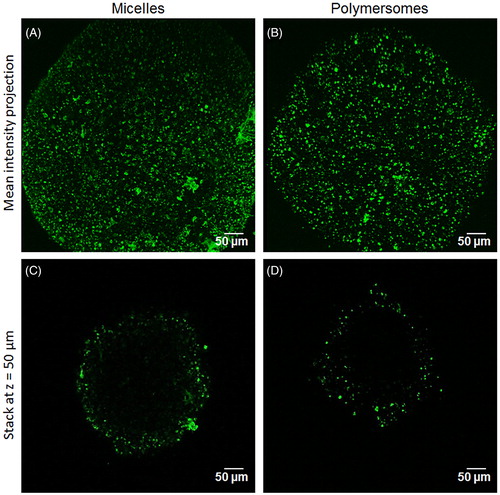
Figure 4. Quantification of nanocarriers’ passage across the endothelium barrier after 24 h of incubation: DiO fluorescence in the receptor chamber (A), Anthracene fluorescence in the receptor chamber (B), DiO fluorescence in the receptor chamber in pro-inflammatory condition (C), DiO fluorescence in the receptor chamber in presence of tumor HCT-116 (D). Intracellular quantification of nanocarriers by flow cytometry: proportion of labeled cells (E), intensity of DiO fluorescence in labeled cells (F). *p < .05. NS: non-significant difference. For each nanocarrier, the DiO fluorescence was significantly lower in the healthy condition compared to the disturb conditions (with TNF-α or in coculture).
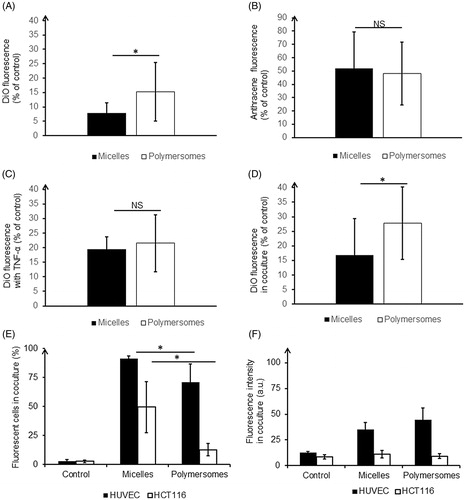
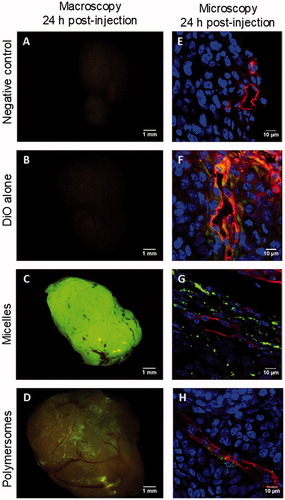
Figure 5. Macroscopic and microscopic (cryosection) fluorescent pictures of explanted HCT-116 tumors 24 h after retro-orbital injection in mice of 100 µL of PBS (A,E), DiO alone (B,F), micelles charged with 20% mol DiO (C,G), or polymersomes charged with 20% mol DiO (D,H). DiO fluorescence (green), and in cryosection nuclei stained with Hoechst (blue), and CD-31+ murine endothelial cells detected by immunofluorescence (red).