Figures & data
Figure 1. DNA binding analysis of 25 kDa PEI by gel retardation assay. M: DNA marker; the values 0, 1.25, 2.5, 5, 10, and 20 denote different N/P ratios.
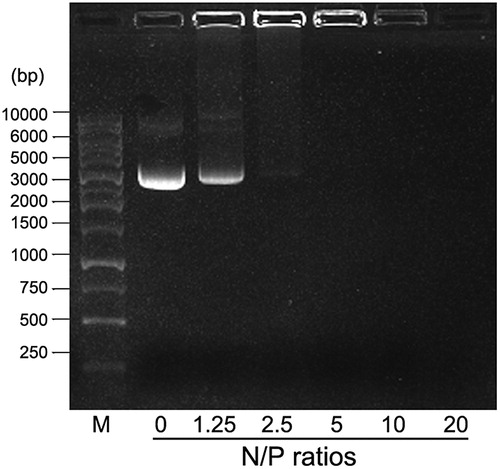
Figure 2. Evaluation of transfection efficiency by the combination of 25 kDa PEI and LMW PEI (800 Da PEI or 1.8 kDa PEI). From left to right, cells without any treatment is used as the negative control, cells are transfected by 0.5 μg 25 kDa PEI +1 μg pGFP, 50 μg 800 Da PEI +1 μg pGFP, 50 μg 1.8 kDa PEI +1 μg pGFP, 0.5 μg 25 kDa PEI +1 μg pGFP +50 μg 800 Da PEI and 0.5 μg 25 kDa PEI +1 μg pGFP +50 μg 1.8 kDa PEI, respectively. Gene transfection efficiency of each group is quantified by flow cytometry. Each column represents the mean ± S.D. (n = 3). *p < .05 versus other groups.
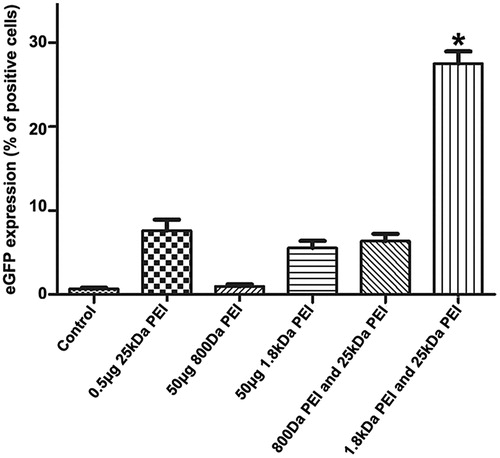
Figure 3. pGFP introduction into A2780 cells by 25 kDa PEI at different N/P ratio. (a) Gene transfection efficiency quantified by flow cytometry (mean ± SD, n = 3, *p < .05); (b) Cytotoxicity of 25 kDa PEI/DNA complexes against A2780 cells at various concentrations by CCK-8 assay (mean ± SD, n = 3, *p < .05).
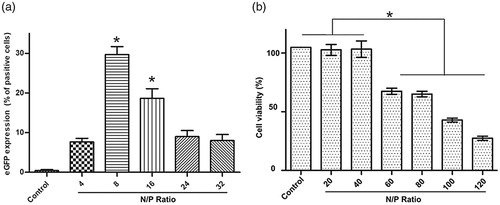
Figure 4. Optimization of 1.8 kDa PEI working concentration. (a) A2780 cells are transfected by (from left to right) control, 1 μg 25 kDa PEI +1 μg pGFP +25 μg 1.8 kDa PEI, 1 μg 25 kDa PEI +1 μg pGFP +50 μg 1.8 kDa PEI, 1 μg 25 kDa PEI +1 μg pGFP +75 μg 1.8 kDa PEI and 1 μg 25 kDa PEI +1 μg pGFP +100 μg 1.8 kDa PEI, respectively. Gene transfection efficiency for each group is quantified by flow cytometry. (mean ± SD, n = 3, *p < .05 versus control, 25 μg 1.8 kDa pEI, 75 μg 1.8 kDa PEI and 100 μg 1.8 kDa PEI groups) (g). (b) Analysis and comparison of the cytotoxicity of the combined PEI and lipofectamine 2000 under various cell confluences. Different amount of A2780 cells are inoculated in a 96-well plate to acquire various cell confluences. (mean ± SD, n = 3, *p < .05).
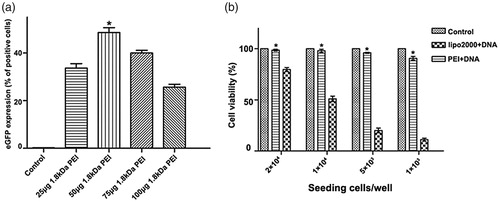
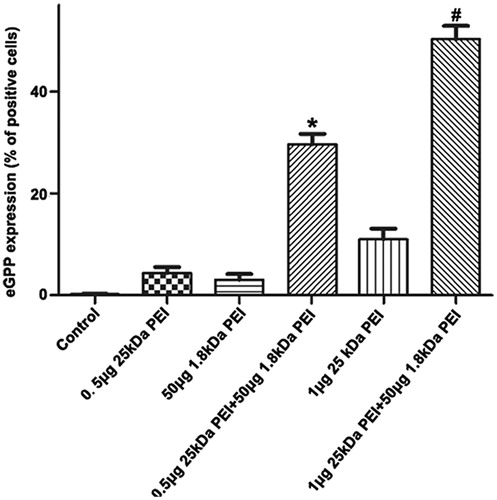
Figure 5. Analysis of gene transfection efficiency in MDA-MB-231 cells by combined PEI. The adherent cells are transfected by negative control, 0.5 μg 25 kDa PEI +1 μg pGFP, 50 μg 1.8 kDa PEI +1 μg pGFP, 0.5 μg 25 kDa PEI +1 μg pGFP +50 μg 1.8 kDa PEI, 1 μg 25 kDa PEI +1 μg pGFP and 1 μg 25 kDa PEI +1 μg pGFP +50 μg 1.8 kDa PEI. Flow cytometry is utilized to quantify the corresponding efficiency. (mean ± SD, n = 3, *p < .05 versus control, 0.5 μg 25 kDa PEI and 50 μg 1.8 kDa PEI groups, #p < .05 versus control, 1 μg 25 kDa PEI and 50 μg 1.8 kDa PEI groups).