
Figures & data
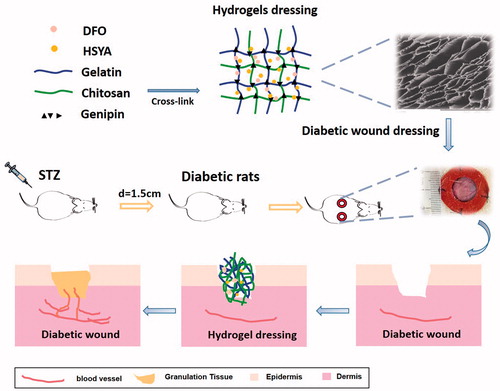
Figure 1. (A) Effects of DFO/HSYA on migration of HaCats were assessed by an IBIDI wound healing assay from 0 to 24h. (B) Wound closure of HaCaTs were expressed as a percentage of the initial wound. *p<.05, #p<.01 versus control (n = 9; mean ± SD). (C) Fluorescent images of tube formation assay in three-dimensional Matrigel after treatment of HSYA/DFO for 6h (scale bars: 500um, magnification: 10x). (D) Quantitative analysis of the total tube length in HSYA-treated HUVECs using the ImageJ software. (E) Cellular immunofluorescence staining of HIF-1α in human dermal fibroblasts (scale bars: 200um). (F) Quantification of the cellular immunofluorescence. *p<.05 and **p<.01 versus control; #p<.01 versus HSYA alone (n = 3; mean ± SD).
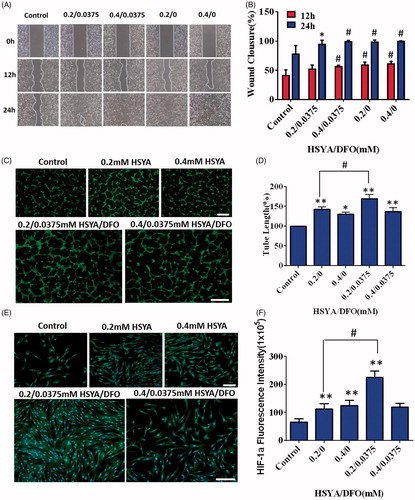
Figure 2. (A) Schematic diagram of IPN porous structure using chitosan and gelatin. (B) SEM images of HSYA hydrogels produced at a variety of GL/Chi ratio; Scale bars: 200um; (a) 3:7, (b) 5:5, (c) 7:3, and (d) 7:3. (120×). (C) Cumulative release profiles of HSYA-loaded hydrogels. (n = 3; mean ± SD). (D) Cumulative release profiles of HSYA-DFO hydrogels. (GL/Chi ratio = 5:5; n = 3; mean ± SD). (E) Rheology test of HSYA-DFO hydrogels. (G’: storage modulus, G”: loss modulus).
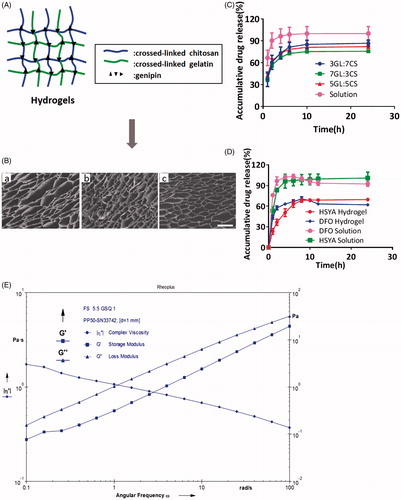
Figure 3. (A) Representative images of wound healing a particular time point. (B) Quantitative wound closure percentage at a particular time point using the ImageJ software. (C) Representative images of wound healing a particular time point. (D) Quantitative wound closure percentage at a particular time point using the ImageJ software. *p < .05 and **p < .01 versus control (n = 6; mean ± SD).
Figure 4. (A) HE stained wound sections at day 28. Scale bars: 200 um. E: epidermis; GT: granulation tissue; D: dermal. (B) High power field (HPF) (40×) imaging of the center of wound granulation tissues. Scale bars, 50 um. Black arrows highlight the newly formed vascular. (C) Immuno fluorescence images for HIF-1α and CD31. Scale bars, 200um. Green: HIF-1α; Red: CD31; Blue: DAPI. (D) Granulation tissue thickness in the center of wounds. (E) Epidermis thickness in the center of wounds. *p < .05 and **p < .01 versus control (n = 6; mean ± SD).
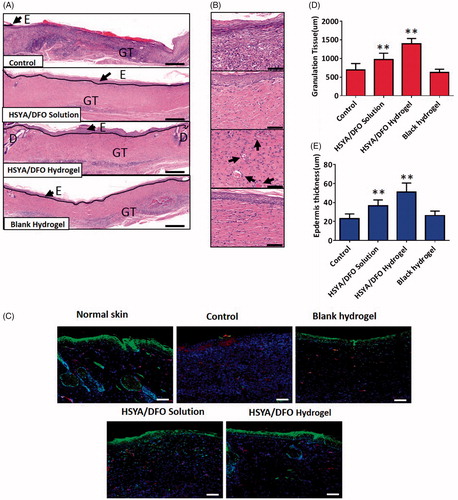
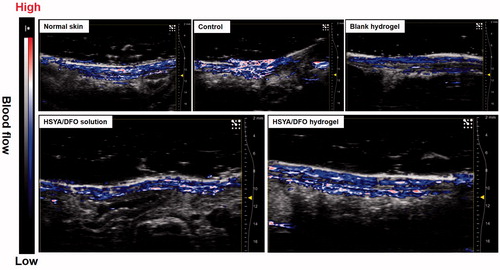
Figure 5. Cross-sectional combined ultrasound and photoacoustic images of diabetic wound for blood flow detection at day 28.