Figures & data
Figure 1. Schematic illustration of transfection of miR-155 MB into the cells via CS-MB-OCT nanoparticles for imaging of intracellular miRNA.
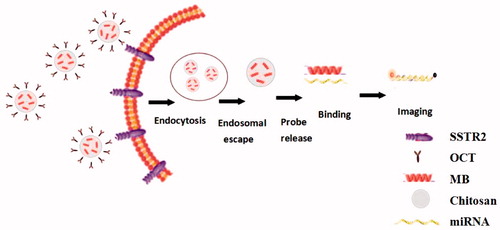
Figure 2. SSTR2 and miR-155 expression detection and animal model establishment. (a) SSTR2 expression by immunofluorescence. Scale bar = 50 μm. (b) HE staining at 4, 6, 8 and 12 weeks. (c) SSTR2 expression by immunohistochemistry (×400). (d) miR-155 expression in the subcutaneous xenografts (n = 6). (e) miR-155 expression in transgenic mice (n = 6). Data are presented as mean ± standard deviation (*p < .05).
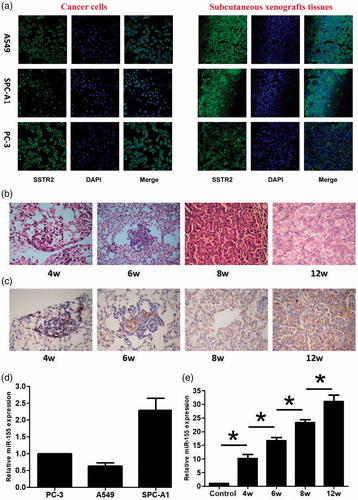
Figure 3. Physicochemical characteristics of CS-MB-OCT nanoparticles. (a) The CS-MB, OCT and CS-MB-OCT absorption spectrum. (b) The mean size of CS-MB and CS-MB-OCT (n = 3). The data were displayed as mean ± standard deviation. (c) TEM images of CS-MB-OCT. Scale bar =100 nm.
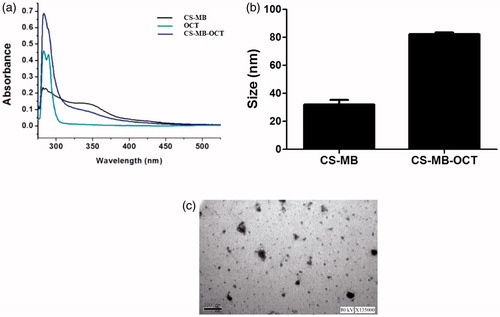
Figure 4. Fluorescence imaging and identification of miR-155 in vitro. (a) Confocal microscopy imaging. Scale bar = 50 μm. (b) Fluorescence intensity of miR-155 was measured after transfection with CS-miR155 MB-COT, CS-miR155 MB or siPORT-miR155 MB (n = 3). (c, d) Graphs by flow cytometry analysis and transfection efficiency of the three cell lines transfected with CS-miR155 MB-COT, siPORT-miR-155 MB and CS-miR-155 MB (n = 3). (*p < .05, vs siPORT-miR-155 MB; *p < .05 vs CS-miR-155 MB).
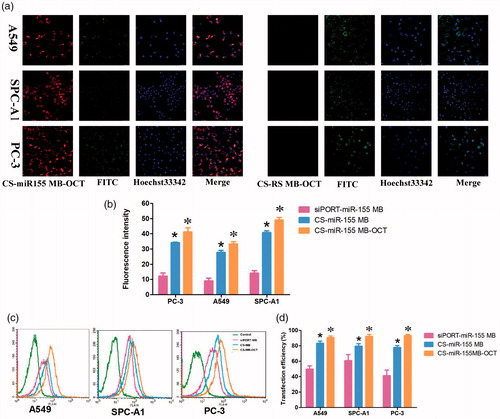
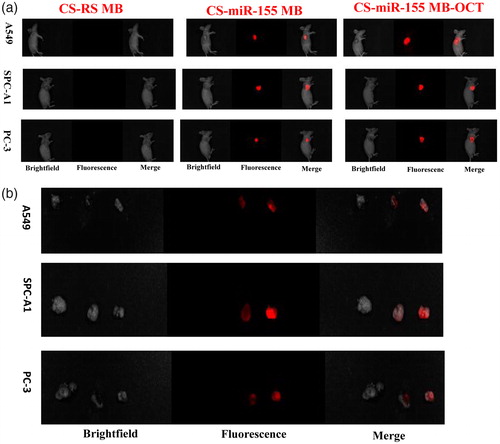
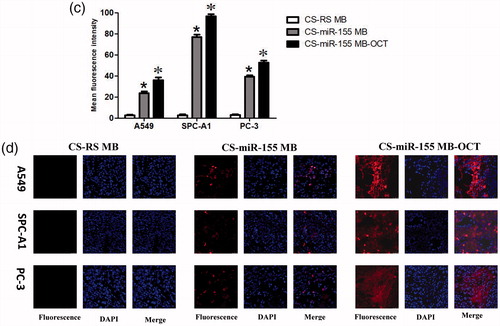
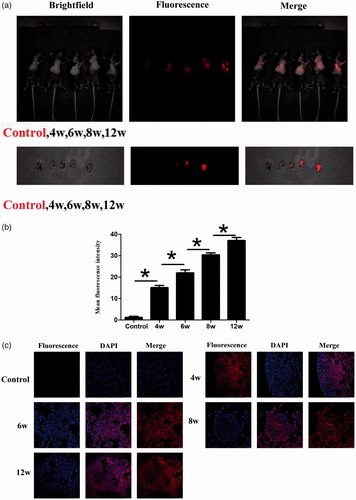
Figure 6. Fluorescence imaging and identification of miR-155 of transgenic mice at different disease stages. (a) IVIS spectrum imaging system imaging after injection of CS-MB-OCT into the tail vein. (b) IVIS spectrum imaging system of the lungs after removal. (c) Fluorescence intensity was measured after injection (n = 6, *p < .05). (d) Confocal microscopy of different pathological changes after transfection with CS-MB-OCT. Scale bar = 25–100 μm.