Figures & data
Figure 1. Morphology of (a) MEs(PS-Free) and (b) MEs(PS-GLP).
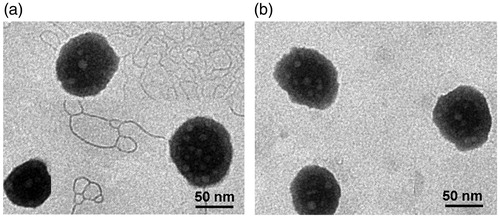
Table 1. Characterization of MEs(PS-Free) and MEs(PS-GLP). All the data are presented as mean ± SD (n = 3).
Figure 2. (a) Zeta potential of microemulsions coated by chitosan, dextran, and GLP with concentration of 0–10 mg/mL. (b) UV-Vis absorption of CSF, DTF, blank microemulsions and microemulsions coated by CSF and DTF (CSF-MEs, DTF-MEs). FRET analysis of fluorescence emission spectra of (c) CSF, Rh123 MEs and CSF-Rh123 MEs, (d) DTF, Rh123 MEs and DTF-Rh123 MEs.
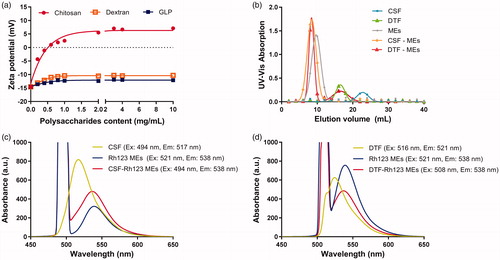
Figure 3. (a) Cell viabilities of A549 cells incubated with MEs (PS-free) and MEs (PS-GLP) at various coix oil concentrations for 24 h. (b) Cell viabilities of Caco-2 cells incubated with MEs (1944CS), MEs (PS-Free) and MEs (PS-GLP) at various oil phase concentrations for 24 h. All the data are presented as mean ± SD (n = 6).
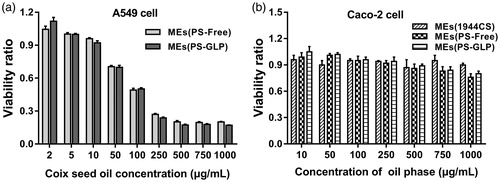
Figure 4. In vivo images after intragastric administration of Cy5 solution, Cy5-labeled MEs (PS-free) and Cy5-labeled MEs (PS-GLP) in A549 tumor-bearing mice.
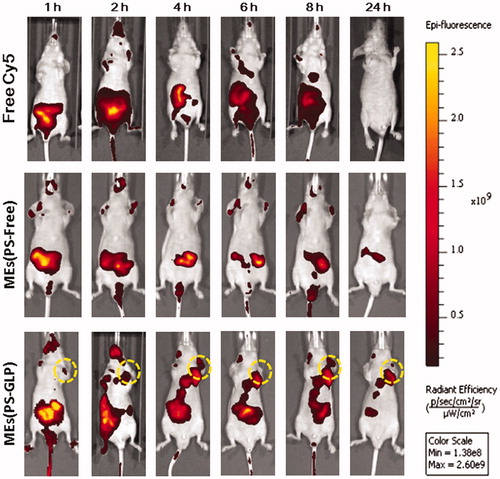
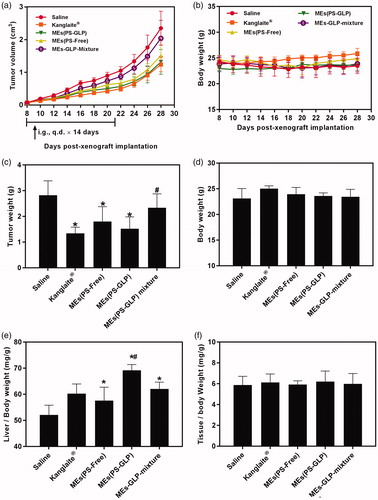
Figure 5. Evaluation of antitumor efficiency in vivo. The curve of (a) tumor growth and (b) body weight change of A549 tumor-bearing mice after various treatments for three weeks. The (c) tumor weight and (d) body weight of A549 tumor-bearing mice after various treatments on Day 30. *p < 0.05, compared with saline group. #p < 0.05 compared with Kanglaite® injection group. The (e) liver index and (f) spleen index of A549 tumor-bearing mice after various treatments in Day 30. *p < 0.05, compared with saline group. #p < 0.05 compared with MEs-GLP mixture group. All the data are presented as mean ± SD (n = 8).