Figures & data
Figure 1. Principle of the preparation of T7/DA7R-HDL (A) MALDI-TOF mass spectra of NHS-PEG2000-T7 (B) and NHS-PEG2000-DA7R (C) Ultraviolet visible spectrum scan of natural HDL, NHS-PEG2000-T7-CFDA and NHS-PEG2000-DA7R-5-ROX (D) Red arrows represent the mass-charge ratios of NHS-PEG2000-T7 (B) and NHS-PEG2000-DA7R (C).
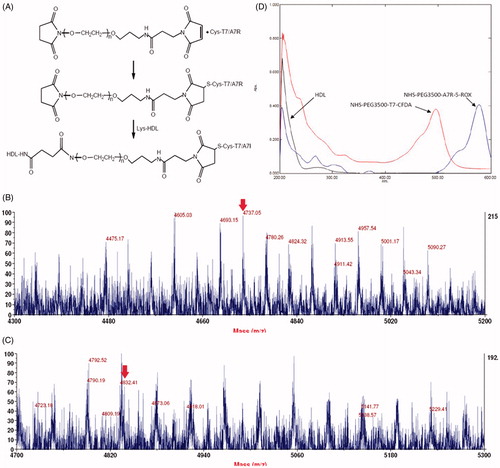
Figure 2. Physicochemical characterization of T7/dA7R-HDL. Particle size distribution of HCPT-loaded T7/dA7R-HDL (A) Morphological appearance of HCPT-loaded T7/dA7R-HDL based on TEM (B) CD spectra of the various HDL formulations (C) Stability of T HCPT-loaded T7/dA7R-HDL in the presence of 10% FBS. The transmission and backscattering profiles were measured at each time point using a Turbiscan Lab® Expert analyzer (D) In vitro release of HCPT from various HDL formulations at pH 7.4 and pH 6.5 at 37 °C, respectively (E) The data are presented as the means ± SD (n = 3).
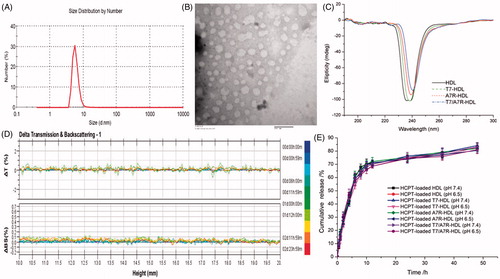
Table 1. Characteristics of the nanocarriers.
Figure 3. Cellular uptake of different Cy5.5-loaded liposomes by bEND.3 cells (A and B), HUVECs (C and D), and C6 cells (E and F). Cy5.5-positive cells were calculated by a FCM, and intracellular fluorescence was captured by a CLSM. Scale bars represent 10 µm.
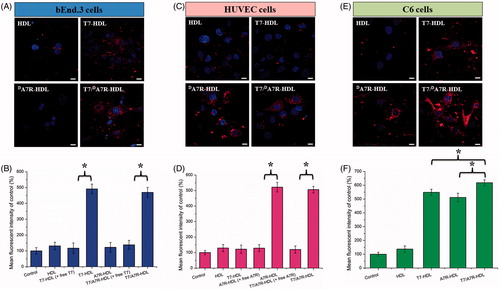
Figure 4. In vivo targeting ability. Biodistribution of Cy5.5 contained in various formulations in mice bearing intracranial C6 glioma determined by an IVIS® Spectrum-CT (A) Ex vivo fluorescence imaging of the brain (B) Distribution of Cy5.5 in the brain of mice bearing intracranial C6 glioma determined by a CLSM (C) The red represents Cy5.5 (red) and the nuclei were stained by DAPI (blue). The white line showed the margin of intracranial glioma and the arrow pointed the glioma cells. Scale bars represent 50 µm.
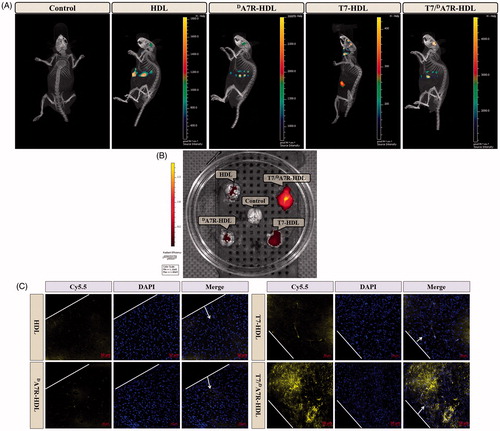
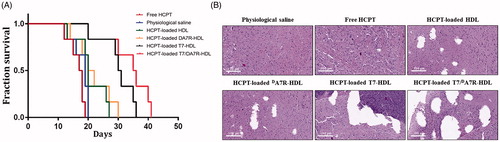
Figure 5. Anticancer efficacy in intracranial C6 glioma-bearing mice. Kaplan–Meier survival curves (A) HE staining analysis of brain tumors (B) Scale bars represent 100 µm.