
Figures & data
Table 1. Summary of the solubility study results.
Figure 1. (a) Effect of different penetration enhancers in propylene glycol vehicle on the permeation of thymoquinone (µg/cm2) against time (h) through human cadaver skin, (b) Effect of different penetration enhancers in ethanol vehicle on the permeation of thymoquinone (µg/cm2) against time (h) through human cadaver skin, (c) Effect of different penetration enhancers in ethanol vehicle and ethanol: PBS (pH 7.4) receptor on the permeation of Thymoquinone (µg/cm2) against time (h) through human cadaver skin. Time points were measured at 3, 4, 6, 8, 10, 12, and 24 h. Each point represents the mean ± S.D. of five replicates.
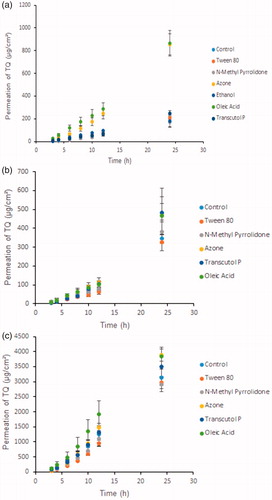
Table 2. Penetration parameters of thymoquinone through human cadaver skin (N = 5) after 24 h and the effect of 5% penetration enhancers on the solubility of TQ using propylene glycol.
Table 3. Penetration parameters of thymoquinone through human cadaver skin (N = 5) after 24 h and the effect of 5% penetration enhancers on the solubility of TQ using ethanol.
Figure 2. (a) Amount of TQ detected after application of different formulations containing PG vehicle and penetration enhancers for 24 h in human cadaver skin (N = 5, mean ± SD), (b) Amount of TQ detected after application of different formulations containing ethanol vehicle and penetration enhancers for 24 h in human cadaver skin (N = 5, mean ± SD), (c) Amount of TQ detected after application of different formulations containing ethanol vehicle and penetration enhancers for 24 h in human cadaver skin; receptor composition was 60:40 (Ethanol:PBS) to evaluate the pull/drag effect of ethanol vehicle in the formulation (N = 5, mean ± SD).
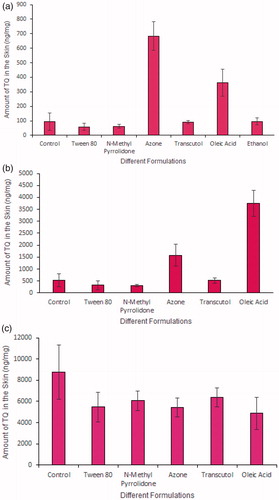
Table 4. Penetration parameters of thymoquinone through human cadaver skin (N = 5) after 24 h using ethanol vehicle and ethanol:PBS pH 7.4 (60:40) receptor solvents.