Figures & data
Figure 1. Flowchart for the process of screening out the included studies.
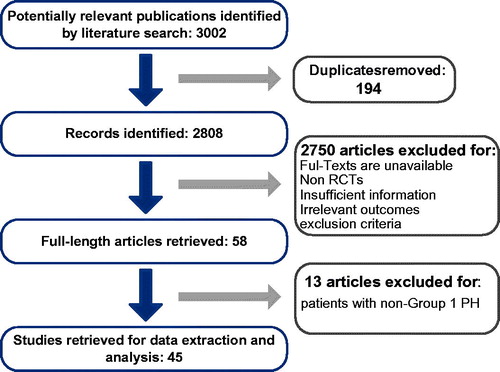
Figure 2. Network structure for all outcomes. The network plots show direct comparison of different treatments, with node size corresponding to the sample size. The number of included studies for specific direct comparison decides the thickness of solid lines.
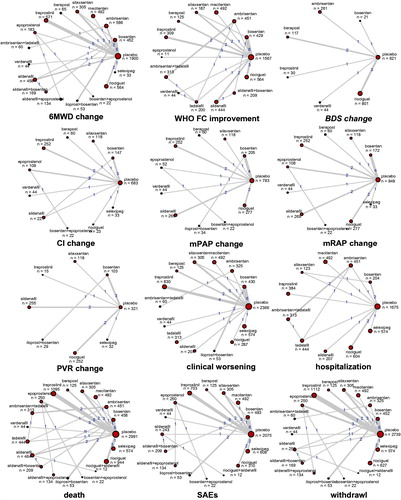
Figure 3. Node-splitting results for outcomes. p < .05 indicates inconsistency between direct and indirect evidence. A: placebo; B: bosentan; C: ambrisentan; D: macitentan; E: sitaxsentan; F: berapost; G: treprostinil; H: epoprostenol; I: ambrisentan + tadalafil; J: vardenafil; K: tadalafil; L: sildenafil; M: sildenafil + bosentan; N: sildenafil + epoprostenol; O: iloprost + bosentan; P: bosentan + epoprostenol; Q: riociguat + sildenafil; R: riociguat; S: selexipag.
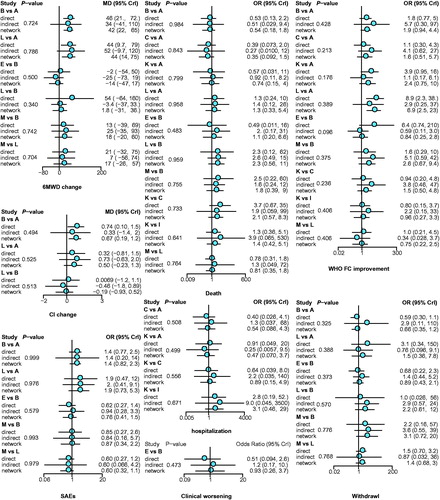
Table 1. Surface under the cumulative ranking curve (SUCRA) results for outcomes.
Figure 4. Heat plots of CI change, clinical worsening, hospitalization and WHO FC improvement. The area of the gray squares displays the contribution of the direct estimate in the design shown in the column to the network estimate in the design shown in the row. The colors are associated with the change in inconsistency between direct and indirect evidence. Blue colors indicate a decrease and warm colors indicate an increase (the stronger the intensity of the color, the stronger the change). A: placebo; B: bosentan; C: ambrisentan; D: macitentan; E: sitaxsentan; F: berapost; G: treprostinil; H: epoprostenol; I: ambrisentan + tadalafil; J: vardenafil; K: tadalafil; L: sildenafil; M: sildenafil + bosentan; N: sildenafil + epoprostenol; O: iloprost + bosentan; P: bosentan + epoprostenol; Q: riociguat + sildenafil; R: riociguat; S: selexipag.
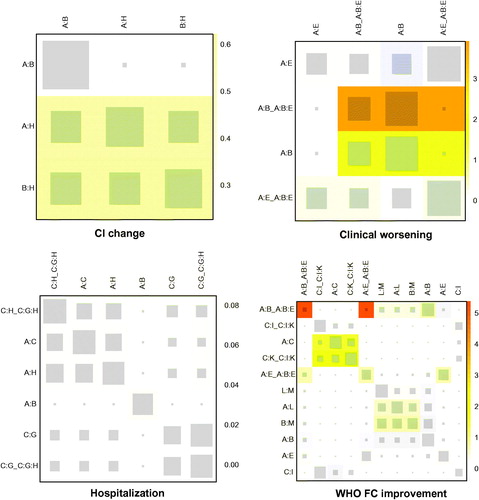
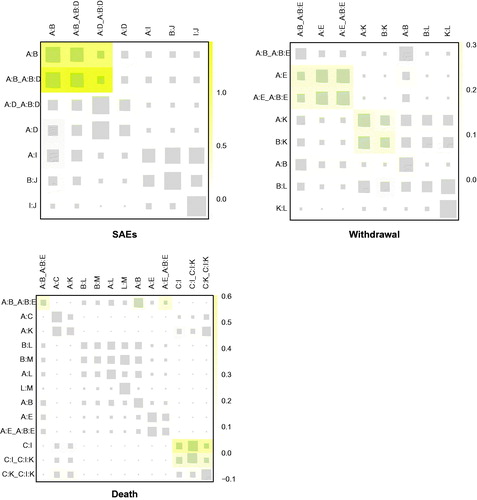
Figure 5. Heat plots for SAEs, withdrawal, and death.