Figures & data
Figure 1. Particle size distribution (A) of SLN/Sor/Dox and LDL-SLN/Sor/Dox. Inserted image is the morphology of LDL-SLN/Sor/Dox obtained by SEM (B) Mean particle size, zeta potential, and poly dispersion index (PDI) measurements of amine decorated SLNs and LDL/SLNs. Data were shown as mean ± S.D. (n = 3).
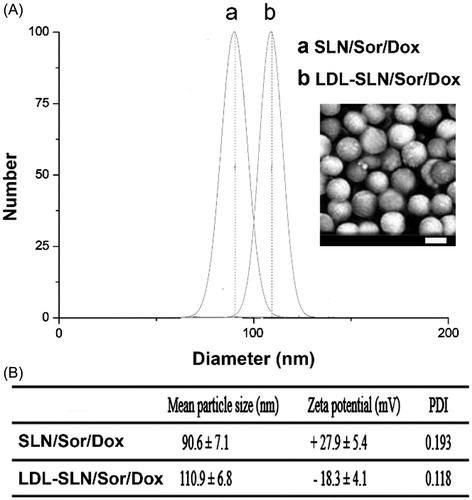
Figure 2. (A) In vitro drugs (Sor and Dox) release of LDL/SLN/Sor/Dox under different pH 7.4 and 5.0. (B) Colloidal stability of LDL/SLN/Sor/Dox in PBS (37 °C, 48 h). (C) Hemolysis of LDL/SLN/Sor/Dox at various concentrations. (D) In vitro time-dependent (2, 4, and 6 h) quantitative FCM analysis SLN/Sor/Dox and LDL/SLN/Sor/Dox with/without LDL pretreatment on HepG2 cells. Data were expressed as mean ± S.D. (n = 3).
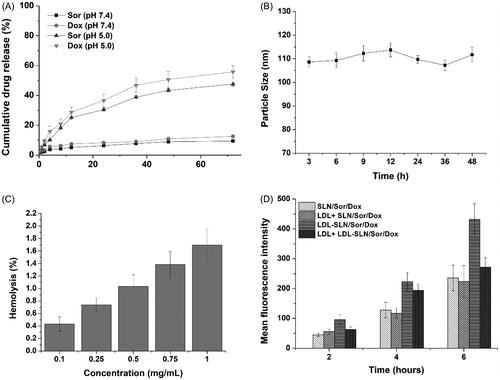
Figure 3. (A) Cytotoxicity of free LDL/SLNs on HepG2 cells at 48 h post incubation. (B) Cytotoxicity of free Sor, free Dox, SLN/Sor/Dox and LDL/SLN/Sor/Dox against HepG2 cells after 24 and 48 h of incubation. Sor and Dox concentration was set at 3.5 μg/mL and 0.5 μg/mL, respectively. Data were expressed as mean ± S.D. (n = 3).
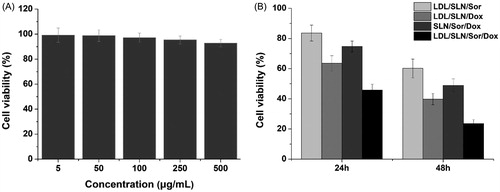
Figure 4. Apoptosis assay of LDL/SLN/Sor/Dox. (A) Annexin V staining and (B) western blotting assay of HepG2 cells treated with different formulations. Data were shown as mean ± S.D. (n = 3).
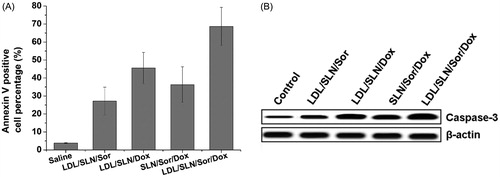
Figure 5. Quantitative ex vivo mean fluorescence intensity of dissected major organs and tumor at 24 h post injection of DiR labeled SLN/Sor/Dox (upper) and LDL/SLN/Sor/Dox (lower). Data were expressed as mean ± S.D. (n = 3).
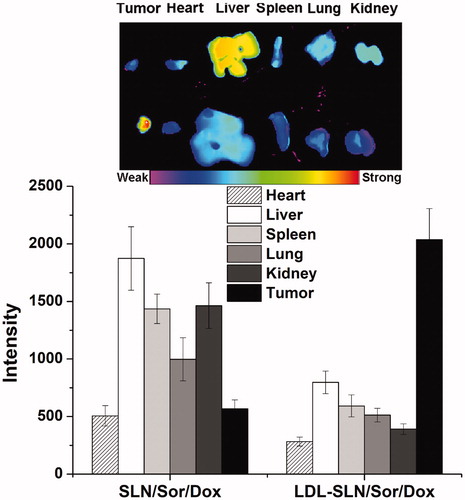
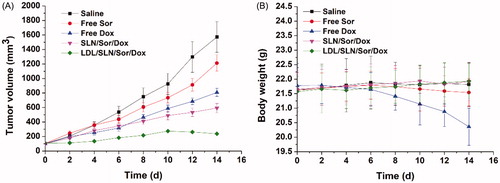
Figure 6. The tumor volume (A) and body weight (B) analysis of HepG2 tumor-bearing model after intravenous injection administration of saline, free Sor, free Dox, SLN/Sor/Dox and LDL/SLN/Sor/Dox, respectively (35 mg/kg Sor and/or 5 mg/kg Dox each mouse). Data were expressed as mean ± S.D. (n = 6).