Figures & data
Figure 1. Construction of Rhodotorula glutinis integration vector pPICZ-PGK1-CCT-TS expressing exogenous CCT. Escherichia coli DH5α containing the pPICZ-rD plasmid was cultured and centrifuged to obtain the pPICZ-rD expression vector. To achieve efficient expression of the exogenous CCT gene under the strong promoter PGK1, we used overlap PCR to link the strong PGK1 gene and the CCT gene fragment and to ensure that no other sequences were present between the two gene fragments, thereby avoiding the abnormal expression of the target gene due to the introduction of other genes. The overlap PCR products and pPICZ-rD were digested with NcoI and BamHI respectively. After cleavage, the PGK1-CCT fragment and expression vector pPICZ-rD were purified, after which the purified PGK1-CCT fragment and pPICZ-rD expression vector were ligated using T4 DNA ligase to construct the pPICZ-PGK1-CCT recombinant plasmid.
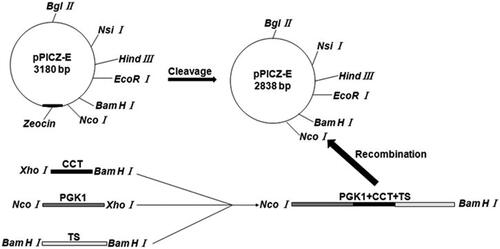
Figure 2. Identification of a thymidine synthase-deficient strain and its integrated pPICZ-PGK1-CCT-TS vector. (A) Agarose gel electrophoresis pattern of the upstream and downstream homologous sequences from the amplified TS gene, wherein the two bands shown are the two PCR products and represent the upstream and downstream homologous sequences of the TS gene. (B) Cloning electrophoresis identification of the GFP gene and its homologous sequences, with a size of approximately 1900 bp. (C) PCR identification of the TS gene knockout strain. Lane 1 is the GM4 strain with TS gene knockout. (D) PCR detection of the recombinant GM4-ΔTS-PGK1-CCT strain inserts CCT. Lanes 1 and 2 are the recombinant strains and lane 3 is an empty vector strain. (E) Identification of the pPICZ-PGK1-CCT-TS integration vector by double digestion. Lane 1 is the recombinant plasmid pPICZ-PGK1-CCT-TS. The results show that the upper band is an empty plasmid and a TS gene fragment, and the lower band is CCT gene fragment and the PGK1 promoter. Lane 2 is the pPICZ-rD plasmid from which the resistance gene was removed and lane 3 was pPGK1Z-rD (pPGK1Z-rD as a negative control).
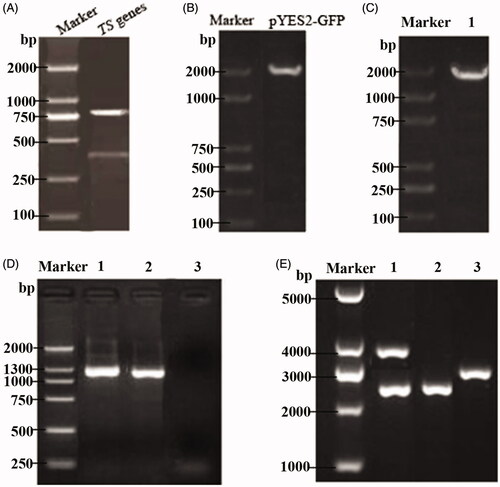
Figure 3. Expression of the CCT gene in the strain and its related effects. (A) Analyzed expression of the CCT gene in the strain by SDS-PAGE. Lane 1 is the recombinant GM4-ΔTS-PGK1-CCT strain, and lane 2 is the wild-type GM4 strain. (B) The expression of CCT gene in the strain was analyzed by Western blotting. β-Tubulin was used as the internal reference. Anti-PCYT1A was fixed and scanned after incubation. (C) The stability of the pPICZ-PGK1-CCT-TS plasmid in the transformed strain. (D) Analysis of the fatty acid composition of the recombinant and wild-type strains by GC. (E) Analysis of the phospholipid composition of the recombinant and wild-type strains by ESLD for phosphatidylcholine (PC), phosphatidylinositol (PI), phosphatidic acid (PA), phosphatidylethanolamine (PE), phosphatidylglycerol (PG). *p ˂ .05 compared to the wild-type strains.
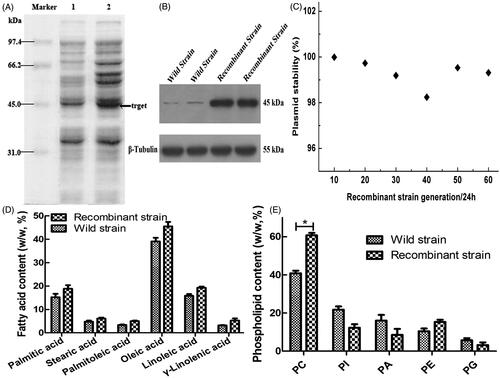
Figure 4. Effects of the exogenous polypeptide drugs transfected into the recombinant strains. (A) Analysis of the location of FITC-F-insulin, FITC-F-H22-LP, and FITC-F-α-MSH by CLSM and staining the lipid droplets with the Nile Red dye. The red fluorescent channel, green fluorescent channel, and an overlap of the red and green fluorescent images are shown. (B) The polypeptide contents of the exogenous polypeptide in the cell by electrotransformation. *p ˂ .05 and **p ˂ .01 compared with the wild-type strains. (C) The relationship between drug release rate P(t) and the time when the recombinant strain carried different exogenous polypeptides in PBS buffer. (D, E, and F) are based on the amino acid sequence of the polypeptide. The ProtScale software was used to predict the hydrophobicity of insulin, H22-LP, and α-MSH, and then the Protparam software was used to predict the theoretical pI, instability index, aliphatic index, and GRAVY of the proteins for further verification.
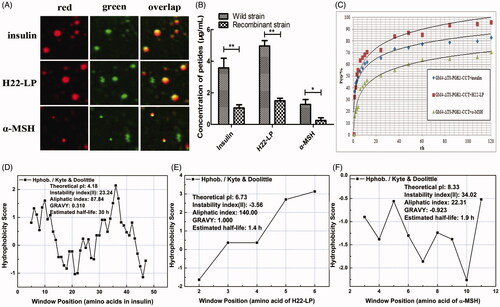
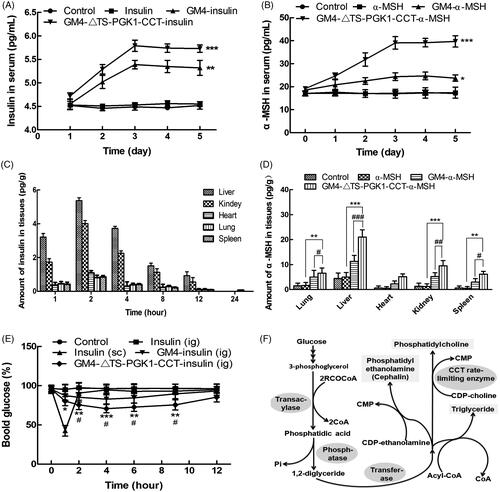
Figure 5. Pharmacological effects of the recombinant strains carrying insulin and α-MSH polypeptide drugs into mice. (A) Changes in the serum insulin concentrations with time in normal mice after oral administration of different drugs. *p ˂ .05 and ***p ˂ .001 compared to insulin. (B) Changes in the serum α-MSH concentration with time in normal mice after oral administration of different drugs. **p ˂ .01 and ***p ˂ .001 compared to α-MSH; ### p ˂ .001 compared to GM4-α-MSH. (C) The distribution of insulin in tissues in normal mice after 5 days of continuous gavage with different drugs. (D) Distribution of insulin in tissues in normal mice after 5 days of continuous gavage different drugs. **p ˂ .01 and ***p ˂ .001 compared to α-MSH; # p ˂ .05, ## p ˂ .01, and ### p ˂ .001 compared to GM4-α-MSH. (E) Changes in the blood glucose with time in type 2 diabetic mice after intragastric administration of different drugs. *p ˂ .05 and **p ˂ .01 compared to insulin (ig); # p ˂ .05, as compared to GM4-insulin (ig). (F) The glycerophospholipids biosynthetic pathway, in which CCTase acts as the rate-limiting enzyme in lecithin synthesis, and plays a key role in the phospholipid synthesis pathway.