
Figures & data
Figure 1. S-KET and R-KET plasma level after single subcutaneous injection of rac-KET suspension and microspheres at a dose of 40 mg/kg in rats. Each point represents the mean ± SD (n = 5).
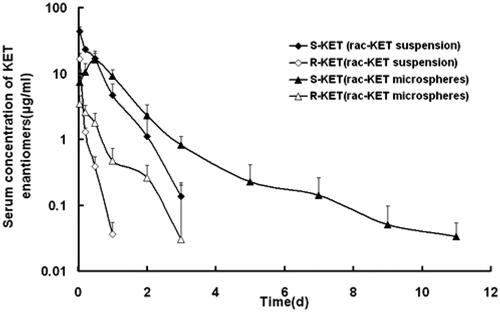
Figure 2. S-KET and R-KET plasma level after single subcutaneous injection of R-KET suspension and microspheres at a dose of 40 mg/kg in rats. Each point represents the mean ± SD (n = 5).
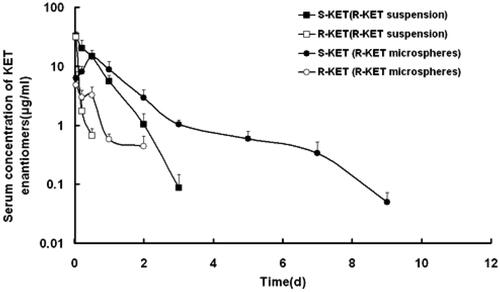
Figure 3. S-KET plasma level after single subcutaneous injection of S-KET suspension and microspheres at a dose of 40 mg/kg in rats. Each point represents the mean ± SD (n = 5).
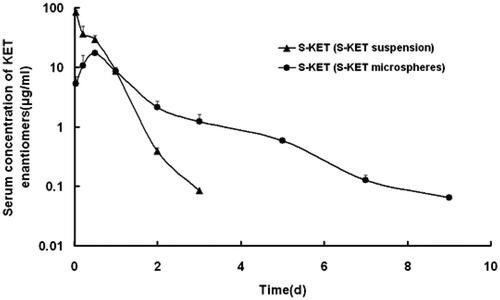
Table 1. S/R enantiomers ratio as a function of time for KET enantiomers released from rac-KET, R-KET suspension and microspheres (*p < .05).
Table 2. R-S conversion rate as a function of time for KET enantiomers released from R-KET, rac-KET suspension and microspheres.