Figures & data
Figure 1. (A) During the optokinetic behavioral test, the mouse was placed on a platform of the text box. Virtual cylinders were projected on the wall of the box and they turned either in clockwise or counter-clockwise direction for the mouse to track. (B) The optokinetic behavioral test was performed using a two-alternative forced choice paradigm. The right picture shows an example of track response when the virtual cylinders are turning in clockwise direction. (C) The EPO expression levels in the retinas of different animal groups. (D) The EPO expression levels in the serum of different animal groups. (ANOVA analysis followed by Bonferroni's post-hoc analysis was performed, #p < .01, for differences between groups; n = 10).
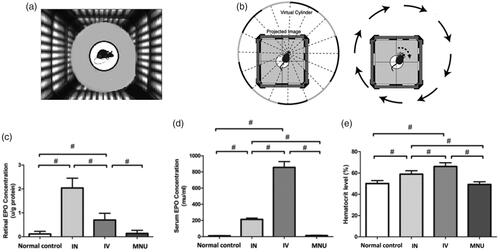
Figure 2. (A) Representative ERG responses of mice from different animal groups. (B) and (C) Scotopic a- and b-wave amplitudes in the MNU group were significantly smaller than that in the normal control group. The scotopic a- and b-wave amplitudes in the INas administered group was significantly larger than those in the IVen administered group. (D) and (E) The photopic a- and b-wave amplitudes in the MNU group were significantly smaller than those in the normal control group. The photopic a-wave amplitudes in the INas administered group was larger than that in the IVen administered group, however, the difference was not significant. The photopic b-wave amplitudes in the INas administered group was significantly larger than that in the IVen administered group, suggesting the INas delivery of EPO conferred pronounced protection on the ERG function of the MNU administered mice. (F) The mice in the IVen administered group responded better to the raster stimulus than those mice in the MNU group. The visual acuity in the IVen administered group was significantly larger than that in the MNU group. The visual acuity in the INas administered group was significantly larger compared with the IVen administered group. (G) The INas group had a contrast sensitivity significantly larger compared with the IVen administered group (ANOVA analysis followed by Bonferroni's post-hoc analysis was performed, #p < .01, for differences between groups; n = 10).
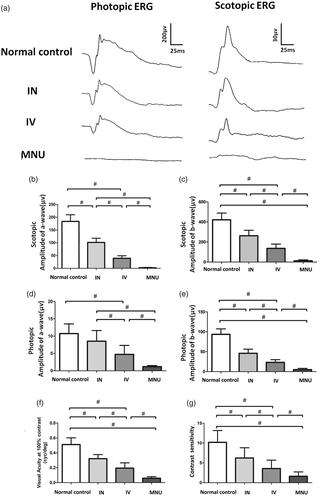
Figure 3. (A) The OCT examination found that the ONL architecture in the MNU group was terribly disrupted. However, these mice in the IVen and INas administered group had relatively intact retinal architecture. The retinal thickness in the MNU group was significantly smaller than that in the IVen administered group. The retinal thickness in the IVen administered group was significantly smaller than that in the INas administered group. (B) The mean ONL thickness in the IVen administered group was significantly smaller than that in the INas administered group. (C) TUNEL-positive cells in the INas administered group was significantly less compared with the MNU group. The apoptotic index (AI) of the MNU group was significantly larger than that of the IVen administered group. The AI of the INas group was significantly smaller compared with the IVen administered group (GCL, Ganglion cell layer; IPL, inner plexiform layer; OPL, outer plexiform layer; ONL, outer nuclear layer; INL, inner nuclear layer; ANOVA analysis followed by Bonferroni's post-hoc analysis was performed,*p < .05, #p < .01, for differences between groups; n = 10).
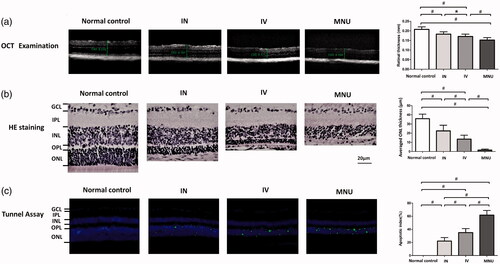
Figure 4. In the normal control mice, PNA staining was evident at the outer segments of photoreceptors. A pronounced proportion of PNA staining was retained in the retinal sections of the INas administered group. Conversely, no PNA staining was found in the retinal sections of the MNU group. The cone photoreceptors in the dorsal-temporal (DT) and dorsal-nasal (DN) quadrants were preferentially preserved by INas delivery of EPO. The M- and S- opsin positive cells were lost in the retinal section and whole mount of the MNU group. On the other hand, the M- and S-opsin positive cells were evident in the retinal section and whole mount of the INas administered group. The M- and S--opsin staining of the IVen group was prominently weaker than that of the INas administered group. In the INas group, the M- and S--opsin positive cells were distributed throughout the retinal whole mount. However, the distribution was not uniformly equal and formed a topographic gradient across retina: the highest number of M-opsin positive cell was in the DT quadrants and the fewest cell in the ventral-nasal VN quadrant; the highest number of S-cone opsin positive cell was in the VN quadrants and the fewest cell in the DT quadrant.
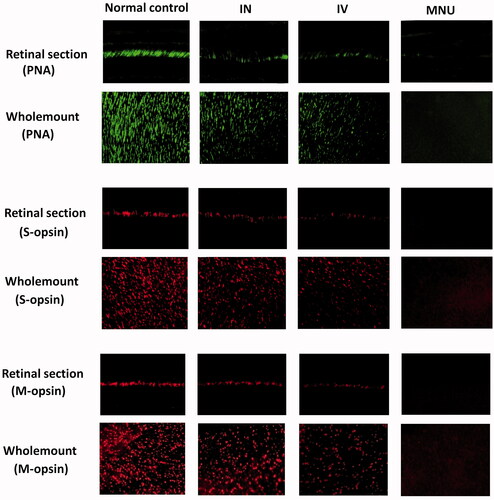
Table 1. Cell counts in different quadrants of retinal whole mounts.
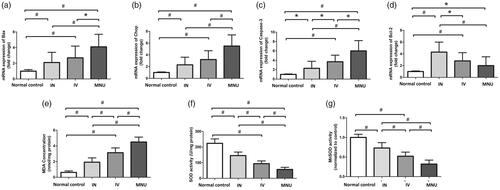
Figure 5. (A–C) The qRT-PCR assay showed that the mRNA levels of Caspase-3, CHOP, and Bax in the INas administered group were significantly down-regulated compared with the MNU group. The mRNA level of Caspase-3, CHOP, and Bax in the INas administered group was also significantly lower than that in the IVen administered group. (D) In the INas administered group, the mRNA level of Bcl-2 was significantly higher compared with the MNU group, suggesting that the anti-apoptotic mechanism should be responsible for the EPO mediated protection. (E) The retinal MDA concentration in the INas administered group was significantly lower than that in the MNU group. (F) The expression level of SOD in the INas administered group was significantly up-regulated compared with the MNU group, suggesting that the INas delivery of EPO could alter the oxidation status in the degenerative retina. (G) The Mn-SOD level in the IVen administered group was significantly higher than that in the MNU group. Meanwhile, the Mn-SOD level in the IVen administered group was significantly lower than that in the INas administered group (ANOVA analysis followed by Bonferroni's post-hoc analysis was performed,*p < .05, #p < .01, for differences between groups; n = 10).