Figures & data
Figure 1. SEM image at 500 times (a) and 3000 times magnification (b), size distribution (c) of Ng-microspheres, and FTIR spectra (d) of PCL (A), PEG-b-PCL (B), naringin (C), electrosprayed PCL/PEG-b-PCL/naringin microspheres (Ng-microspheres) (D), SAIB (E), Ng-m-SAIB (F).
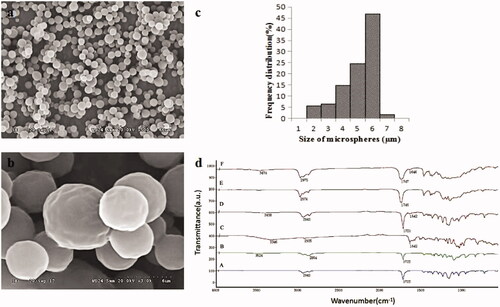
Figure 2. In vitro release from Ng-microspheres and SAIB-based depots. M1: naringin (2%)-loaded microspheres, M2: naringin (4%)-loaded microspheres and M3: naringin (6%)-loaded microspheres. Ng-SAIB: naringin (0.2 mg)-SAIB, M1-SAIB: naringin (2%)-loaded microspheres/SAIB, M2-SAIB: naringin (4%)-loaded microspheres/SAIB, M3-SAIB: naringin (6%)-loaded microspheres/SAIB. The results represent the average ± SD.
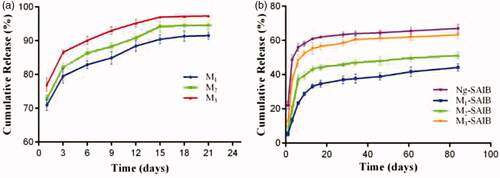
Table 1. Evaluation of drug release kinetics of SAIB-based depot according to the Higuchi equation.
Figure 3. CCK-8 assay after 1, 3, and 7 days (a); ALP activity after 3, 7, and 10 days (b); ARS stains after 21 days (c); and the corresponding optical density of the dye solutions (d) of Ng-microspheres. M0: blank microspheres, M1: naringin (2%)-loaded microspheres, M2: naringin (4%)-loaded microspheres, and M3: naringin (6%)-loaded microspheres. The results represent the average ± SD, *p < .05, **p > .05; n = 3.
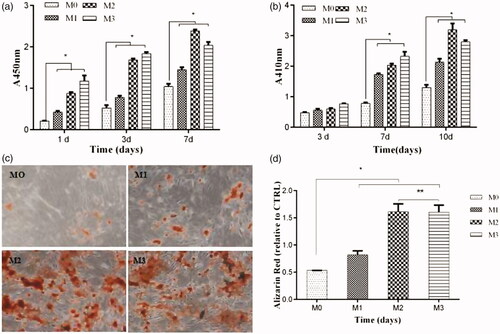
Figure 4. Reconstructed 3D images (a–f), statistical quantifications of the new bone formation rate (BV/TV %) (g), and representative HE images of different groups at 2 and 8 weeks postsurgery. a, d, h, k: control; b, e, i, l: m-SAIB; c, f, j, m: Ng-m-SAIB; a–c, h–j: after 2 weeks of surgery; d–f, k–m: after 8 weeks of surgery. The results represent the average ± SD, *p < .05. Black arrows represent the defect margin.
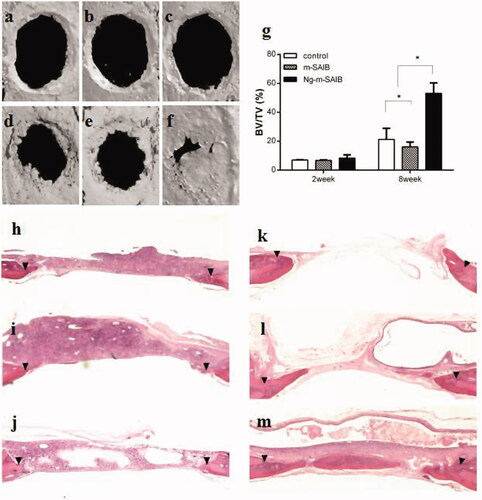
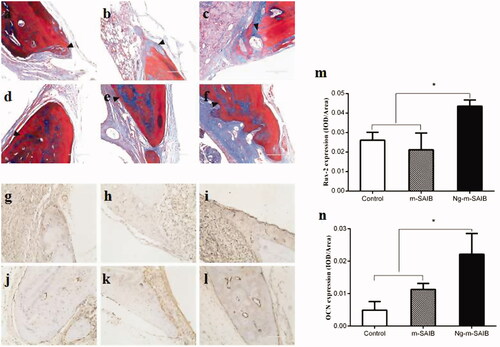
Figure 5. Results of Masson staining after 2 weeks (a–c) and 8 weeks (d–f) in each group, IHC staining for the osteogenic marker Runx-2 in each group after 2 weeks (g–i) and for the osteogenic marker OCN after 8 weeks (j–l) and the corresponding quantitative comparison of osteogenic expression of Runx-2 after 2 weeks (m) and OCN after 8 weeks (n). a, d, g, j: control; b, e, h, k: m-SAIB; c, f, i, l: Ng-m-SAIB. Scale bar, 100 µm; black arrows represent the defect margin, and the results represent the average ± SD, *p < .05, n = 3.