
Figures & data
Table 1. Hemolysis test of RPTNs.
Figure 1. Characterization of the DDS. (a) (b) (c) Particle size, PDI and Zeta potential of PTNs, RPTNs and RVs. (d) (e) (f) TEM images of PTNs, RVs, and RPTNs. (g) (h) Particle size and PDI changes of RPTNs in 15 days. Data were presented as the mean ± SD (n = 3).
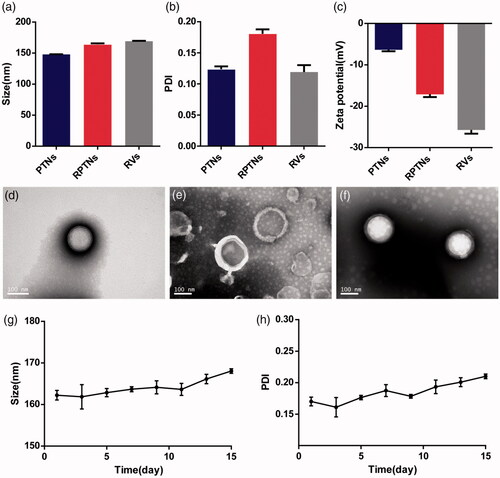
Figure 2. Sustained release and prolonged circulation evaluation of the DDS. (a) RBCM proteins verification in the RBCM a), RVs b), RPTNs c) and PTNs d) by SDS-PAGE. (b) Confocal image of cellular uptake of the PTNs and RPTNs with MCF-7/ADR cells. The nucleus of cells was labeled by DAPI, PTNs were by labeled Nile red and RBCM were labeled by DiO. (c) (e) Fluorescence intensity histogram of PTNs and RPTNs with MCF-7/ADR and RAW264.7 cells. (d) (f) Quantitative analysis of the fluorescence intensity. (g) Release curve of RPTNs and PTNs in vitro. (h) PK behavior of TET and RPTNs in vivo after intravenous administration. Data were presented as the mean ± SD (n = 6). ** correspond to p < .01.
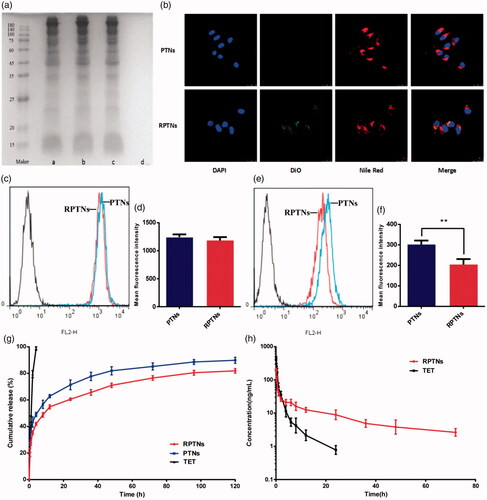
Figure 3. Safety evaluation of the DDS. (a) (b) Result of the RPTNs in vitro hemolysis test after incubation for 3 h and 24 h. (c) (d) Cell survival of 293T cells after treatment with materials and various formulations of TET at different concentration for 24 h. Data were presented as the mean ± SD (n = 6).
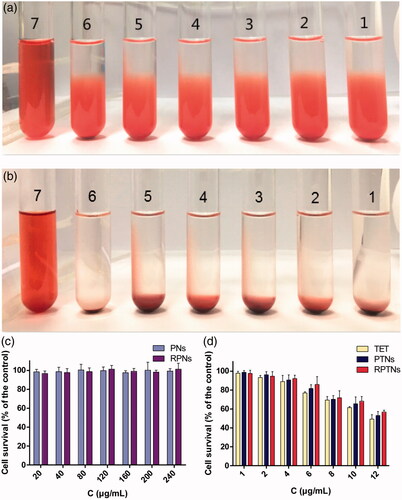
Figure 4. Cell survival of MCF-7 (a) and MCF-7/ADR (b) cells after treatment with various groups for 72 h. Data were presented as the mean ± SD (n = 6).
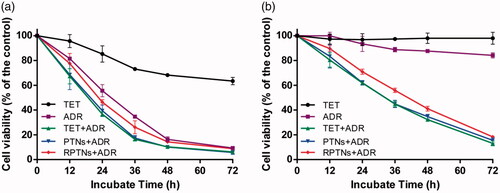
Table 2. PK parameters of TET and RPTNs in the rat after intravenous administration.