
Figures & data
Figure 1. SEM picture of the cisplatin-loaded implants (magnification ×3000). (a) External surface of the implant, (b) Cross-section of the implant.
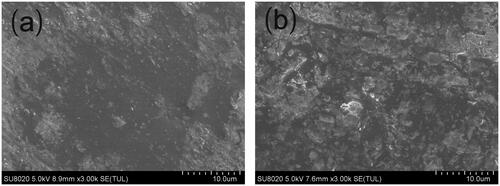
Figure 2. The release profiles of cisplatin-loaded implants. (a) The in vitro cumulative release profiles of cisplatin from the implants, (b) The in vivo cumulative release profiles of cisplatin from the implants. Data are shown as mean ± standard deviation (n = 6 for each time).
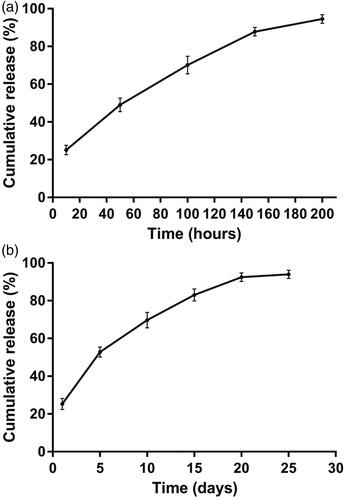
Figure 3. Antitumor efficacy of cisplatin-loaded implants on sarcoma 180 tumor-bearing mice. (a) Tumor growth curve of the sarcoma 180 tumor-bearing mice during the treatment period, (b) The average body weight of mice during the treatment period, (c) Kaplan–Meier curves for survival of sarcoma 180 tumor-bearing mice, (d) Picture of tumors dissected from the mice at the end of experiment.
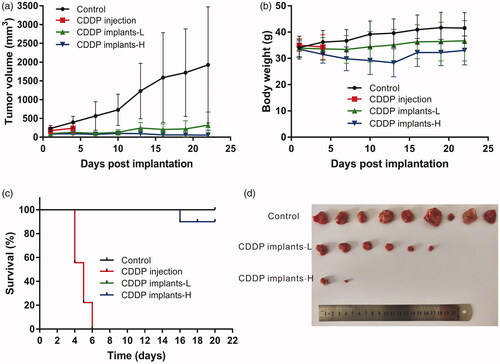
Table 1. The hematological parameters of sarcoma 180 tumor-bearing mice (n = 10).
Table 2. The biochemical analyses of serum from sarcoma 180 tumor-bearing mice (n = 10).
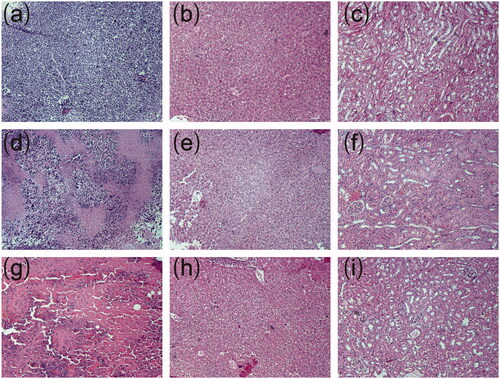
Figure 4. Typical histopathological images of tumors and major organs of sarcoma 180 tumor-bearing mice (magnification ×100). (a) Histopathological image of tumor without treatment, (b) Histopathological image of liver without treatment, (c) Histopathological image of kidney without treatment, (d) Histopathological image of tumor treated with low-dose cisplatin-loaded implants, (e) Histopathological image of liver treated with low-dose cisplatin-loaded implants, (f) Histopathological image of kidney treated with low-dose cisplatin-loaded implants, (g) Histopathological image of tumor treated with high-dose cisplatin-loaded implants, (h) Histopathological image of liver treated with high-dose cisplatin-loaded implants, (i) Histopathological image of kidney treated with high-dose cisplatin-loaded implants.