Figures & data
Figure 1. (a) TEM image of TAC-NPs (100,000×, scale bar, 100 nm). (b) In vitro release profiles of TAC-NPs and 0.1% TAC suspension. Pharmacokinetic profile of TAC-NP after a single dose (25 µl, containing 5 µg TAC) topical administrations, including drops (c) and subconjunctival injection (d) in rabbits (data were expressed in mean ± SD, n = 3).
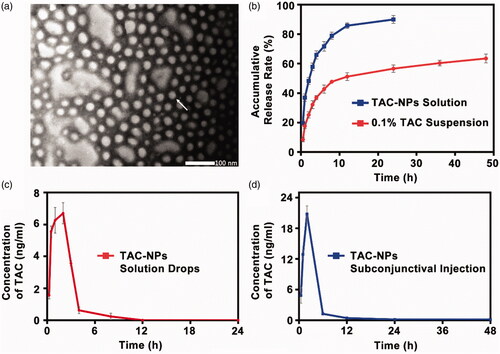
Table 1. The pharmacokinetic parameters of TAC-NPs in the rabbit aqueous humor after single-dose topical administration of TAC-NPsTable Footnote*.
Figure 2. Clinical manifestations and tacrolimus concentration in rats (a) Clinical manifestations (magnification, 250×) of the anterior segment on postoperative day 14 and 28. (b) Survival curves of rat corneal grafts for all groups. The concentrations of tacrolimus in the corneas (ng/mg) and aqueous humor (ng/ml) on postoperative day 14 (c) and 28 (d). Error bars represent the means ± SD. *A statistically significant difference compared to the control groups at the level of p < .05 using Permutation test. N = 3.
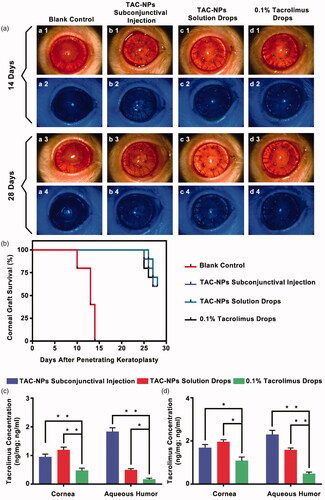
Figure 3. HE and immunohistochemical staining of corneal grafts (magnification, 200×). (a) HE staining, (b) immunohistochemical staining of CD4+ T cells, and (c) immunohistochemical staining of CD8+ T cells. Greater numbers of CD4+ and CD8+ T cells (stained in brown) were observed in the blank control group than in the TAC-NP-treated and 0.1% tacrolimus-treated groups.
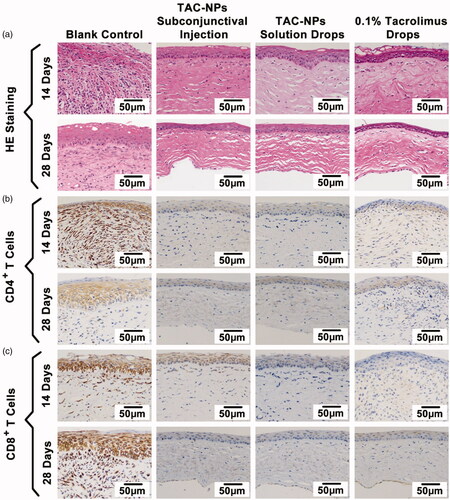
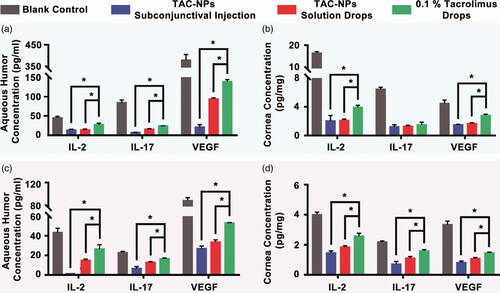
Figure 4. Concentrations of IL-2, IL-17, and VEGF in aqueous humor and cornea on postoperative days 14 (a, b) and 28 (c, d). TAC-NPs inhibited immune reactions more effectively than conventional 0.1% tacrolimus (p < .05). Error bars represent the means ± SD. *A statistically significant difference compared to the control groups at the level of p < .05 using Permutation test. N = 3.