
Figures & data
Table 1. MTT viability assay of GA solution and optimized GA-NLC.
Figure 1. Uptake of (A) free coumarin-6 (C-6) and (B) C-6 loaded GA-nano-lipid carrier, upon incubation at 1 µg/mL for 2 h. In all the images, (a) images under the green fluorescence channel; (b) corresponding differential interface contrast images of HepG2 cells. (c) Superimposition of figure (a) and figure (b). (d, e) In all, the images show horizontal line series analysis of fluorescence along the white line.
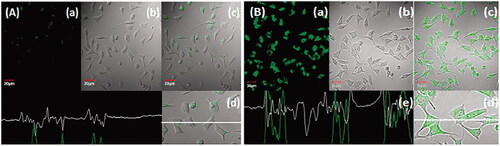
Figure 2. Macroscopical observation of DEN-induced HCC group rats. (A) DEN control group showed the expansion of hepatic nodules (white in color) and decolorization of tissue, (B) DEN control group treated with GA (25 mg/kg) illustrated the expansion of pre-cancerous nodules (white in color) and decolorization of tissue color, which was less as compared to DEN group, (C) DEN control group treated with GA (50 mg/kg) demonstrated the less pre-cancerous nodules (white in color) and decolorization of tissue color, (D) DEN control group treated with GA (100 mg/kg) illustrated the expansion of pre-cancerous nodules and decolorization of tissue color, which was less as compared to other group, and (E) DEN control group treated with GA-NLC (25 mg/kg) illustrated the decolorization of tissue color, which was less as compared to other group rats. Note: Normal control and normal control rats treated with GA (100 mg/kg) did not show any sign of precancerous cells and decolorization of skin (data not shown).
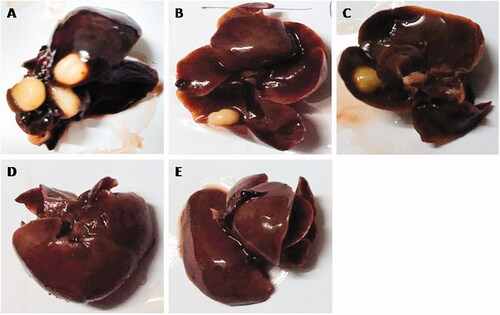
Table 2. The effect of GA-NLC on the number of rats, number of nodules and average number of nodules bearing rats.
Figure 3. The histopathological evaluation of DEN-induced HCC group rats. (A) DEN control group showed the expansion of hepatic nodules (white in color) and decolorization of tissue, (B) DEN control group treated with GA (25 mg/kg) illustrated the expansion of pre-cancerous nodules (white in color) and decolorization of tissue color, which was less as compared to DEN group, (C) DEN control group treated with GA (50 mg/kg) demonstrated the less pre-cancerous nodules (white in color) and decolorization of tissue color, (D) DEN control group treated with GA (100 mg/kg) illustrated the expansion of pre-cancerous nodules and decolorization of tissue color, which was less as compared to other group, and (E) DEN control group treated with GA-NLC (25 mg/kg) illustrated the decolorization of tissue color, which was less as compared to other group rats. Note: Normal control and normal control rats treated with GA (100 mg/kg) did not show any sign of alteration in the histopathology (data not shown).
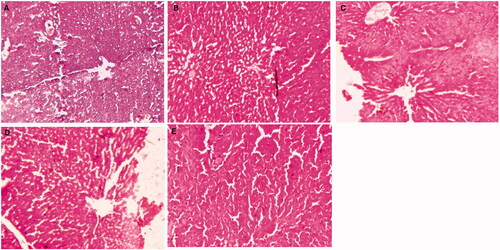
Table 3. The effect of GA-NLC on the histopathology character.