Figures & data
Figure 1. Appearance, size distribution and TEM images of co-loaded SNEDDS.
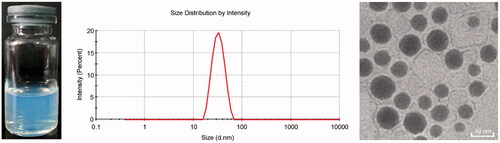
Figure 2. In vitro drug release of DTX SNEDDS and Co-loaded SNEDDS in pH 1.2 hydrochloric acid solution (A) and pH 6.8 PBS (B) (n = 3).
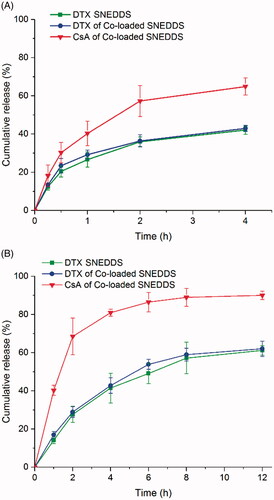
Figure 3. In situ single-pass intestinal perfusion (n = 3). Ka (A) and Papp (B) of duodenum, jejunum, ileum and colon. (*p < .05, **p < .01, *p < .001).
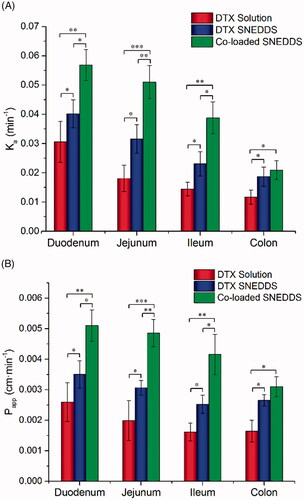
Figure 4. Intestinal fluorescence micrographs of coumarin-6 solution and coumarin-6-SNEDDS (green fluorescence). DAPI (blue) and rhodamine phalloidin (red) were used to label the cell nuclei and cytoskeleton respectively.
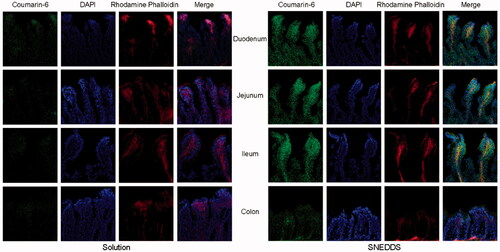
Figure 5. Concentration of plasma drug (DTX)-time profiles of DTX solution, DTX SNEDDS and Co-loaded SNEDDS following oral administration. (n = 5).
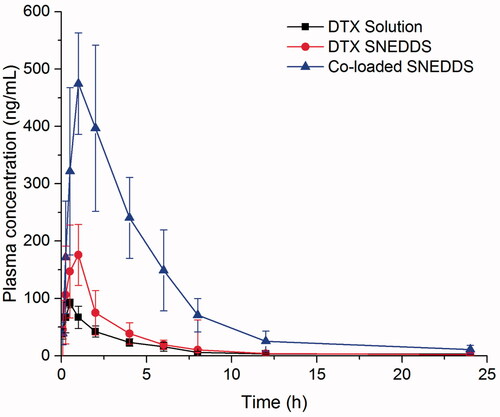
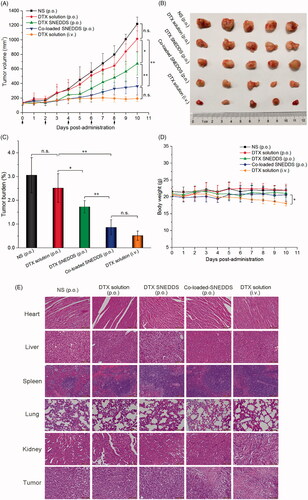
Figure 6. In vivo antitumor efficacy against 4T1 xenograft tumors after the intravenous and oral administration of DTX solution, DTX SNEDDS and Co-loaded SNEDDS. (A) Tumor volume (n = 5). (B) Images of tumors. (C) Tumor burden (n = 5). (D) Body weight changes (n = 5). (E) H&E staining of the major organs and tumor acquired from mice bearing 4T1 tumors at the tenth day after various treatments. Scale bars represent 100 μm. (* p< .05, **p < .01).