Figures & data
Figure 1. The synthesis and characterizations of 5 F-loaded CA-PLGA-PEG-LA NPs. (a) Schematic illustration of synthesis procedure of the NPs. (b) DLS size distribution of the NPs. (c) TEM imagine of the NPs.
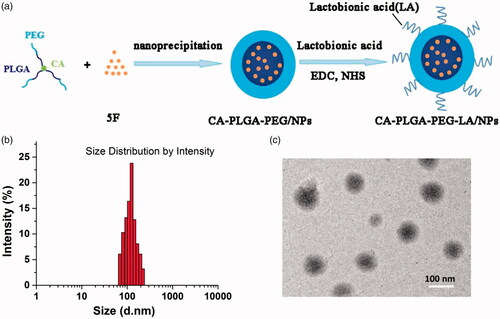
Figure 2. Stability of 5 F-loaded NPs in vitro. (a) Particle size and (b) zeta potential of 5 F-loaded CA-PLGA, CA-PLGA-PEG and CA-PLGA-PEG-LA NPs during 90 days of storage, respectively.
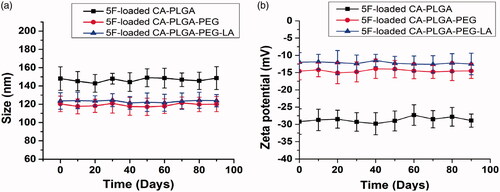
Figure 3. The in vitro drug release behavior of 5 F-loaded CA-PLGA, CA-PLGA-PEG and CA-PLGA-PEG NPs. Error bars represent standard deviation (SD) for n = 3.
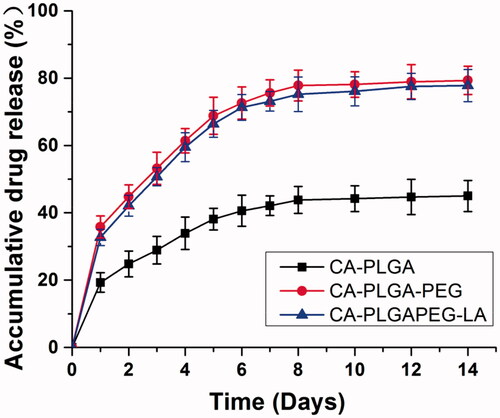
Figure 4. Cellular uptake assay of coumarin-6 loaded NPs. (a) After HepG2 cells were incubated with coumarin-6 loaded NPs for 2 h and then stained by DAPI, the fluorescent images were observed using confocal microscope. Scale bar: 50 μm. (b) Flow cytometry histogram profiles of C6-loaded NPs on HepG2 cells.
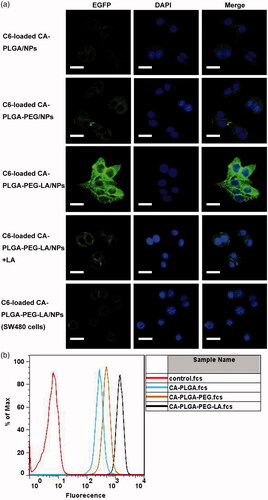
Figure 5. Cell viability of HepG2 treated with drug-free CA-PLGA-PEG-LA NPs, 5 F and 5 F-loaded NPs, respectively. (a) 24 h, (b) 48 h and (c) 72 h. The dosage of 5 F is same in the same group. The amount of drug-free CA-PLGA-PEG-LA NPs was the same as that of the NPs. *p < .05 and #p < .01 indicate significant difference compared with 5 F-loaded CA-PLGA-PEG-LA NPs.
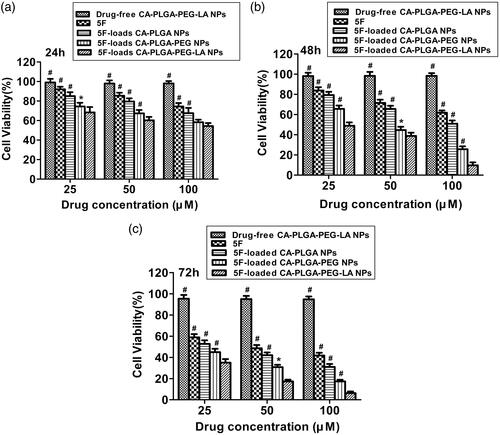
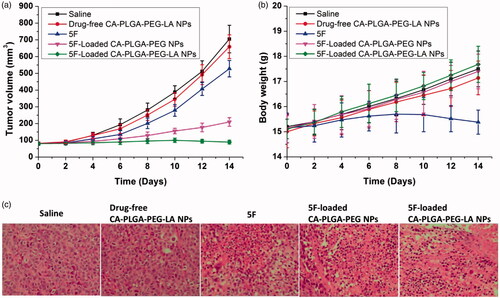
Figure 6. (a) Mean tumor volumes and (b) body weights of the mice in different groups after treatment at different time intervals (n = 5). Tail intravenous injection into the HepG2 tumor-bearing mice every 4 days; (c) Representative tissue sections of mice in different groups stained with hematoxylin and eosin (H&E) after 14 days of treatment (Magnification 100×).