Figures & data
Figure 1. In vitro release of VIN-loaded SL (6% HMME) with different ultrasound irradiated time in PBS (0.1 M, pH 7.4) at 37 °C (A). In vitro release of VIN-loaded SL and VIN-loaded NL with or without ultrasound in PBS (0.1 M, pH 7.4) at 37 °C (B). The data are presented as the means ± SD (n = 3). * indicates p < .05.
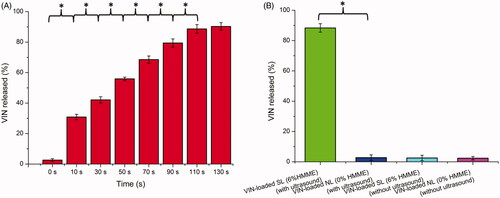
Figure 2. Particle size distribution of VIN-loaded SL (A). Morphological appearance of VIN-loaded SL based on TEM (B). In vitro release of VIN from various liposomal formulations in PBS (0.1 M, pH 7.4) at 37 °C (C). In vitro release of VIN-loaded SL and VIN-loaded NL with ultrasound after a 24-h incubation in PBS (0.1 M, pH 7.4) at 37 °C (D). The data are presented as the means ± SD (n = 3).formulations in PBS (0.1 M, pH 7.4) at 37 °C (C). In vitro release of VIN-loaded SL and VIN-loaded NL with ultrasound after a 24-h incubation in PBS (0.1 M, pH 7.4) at 37 °C (D). The data are presented as the means ± SD (n = 3).
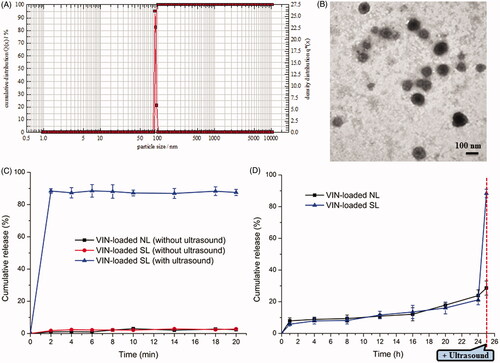
Table 1. Characteristics of the liposomal nanocarriers.
Figure 3. Plasma VIN concentration-time profiles after i.v. injection of different formulations in rat (n = 3) (A). Concentration of VIN in the major organs 0.5 h after i.v. injection (B). The data are presented as the means ± SD (n = 3). * indicates p < .05.
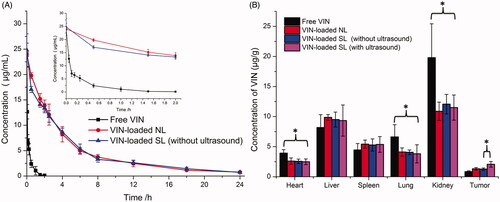
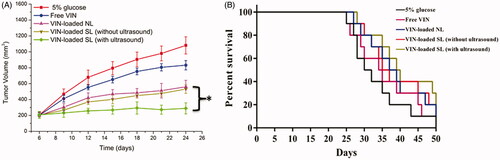
Figure 4. Antitumor activity (A) and survival curve (B) in MCF-7 tumor-bearing mice after treatments with 5% glucose, free VIN and varying formulations carrying VIN. The data are presented as the means ± SD (n = 10). * indicates p < .05.