
Figures & data
Scheme 1. The preparation of Tf-HPAA-GO/DOC/pMMP-9.
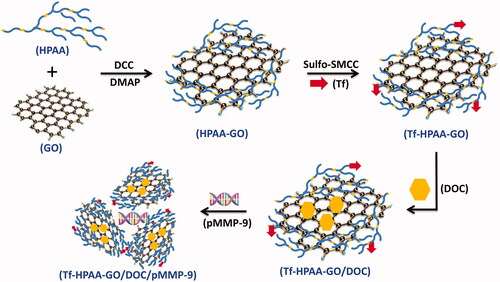
Figure 1. (A) 1H NMR spectrum of HPAA (25 °C, D2O). (B) GPC trace of HPAA (37 °C, aqueous 0.8 mol/L NaNO3).
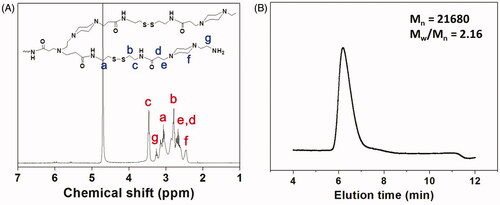
Figure 2. (A) Raman spectra of GO and HPAA-GO. (B) TG curves of GO, HPAA, and HPAA-GO.
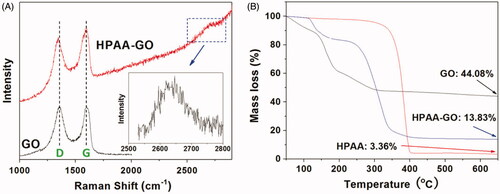
Figure 3. The zeta potentials and particle sizes of GO, Tf-HPAA-GO, and Tf-HPAA-GO in the presence of 10 mmol/L GSH (37 °C for 4 h) (1: GO; 2: Tf-HPAA-GO; 3: Tf-HPAA-GO mixed with 10 mmol/L GSH).
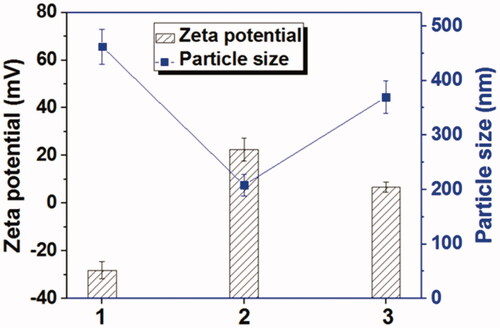
Figure 4. In vitro DOC release profiles from Tf-HPAA-GO/DOC complex in PBS or aqueous 10 mmol/L GSH solution (37 °C).
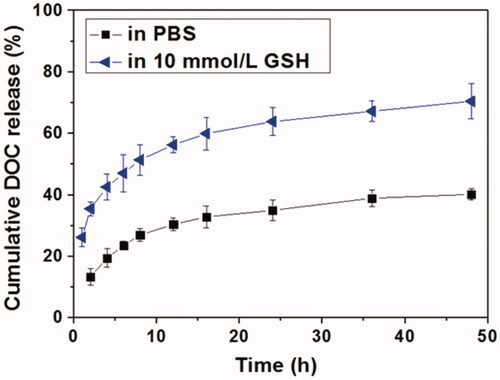
Figure 5. (A) HNE-1 cells viability after incubated with blank Tf-HPAA-GO, free DOC and Tf-HPAA-GO/DOC for 24 h (37 °C and 5% CO2, n = 5). (B) HNE-1 cells viability after incubated with Tf-HPAA-GO/DOC and HPAA-GO/DOC for 4 h (37 °C and 5% CO2, n = 5).
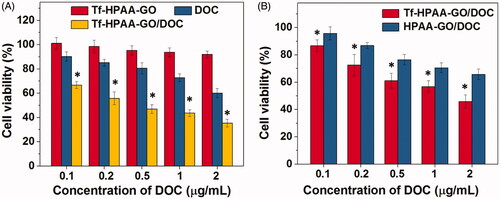
Figure 6. (A) Gel electrophoresis assay of Tf-HPAA-GO/pMMP-9 complexes with different weight ratios. (B) Gene transfection results of HNE-1 cells treated with PEI-25k/pMMP-9 (w/w = 1.3:1), HPAA-GO/pMMP-9, and Tf-HPAA-GO/pMMP-9 (w/w = 10, 20, and 30, respectively) complexes (n = 3). (C) Typical image of transfected HNE-1 cells with Tf-HPAA-GO/pMMP-9 at a weight ratio of 20.
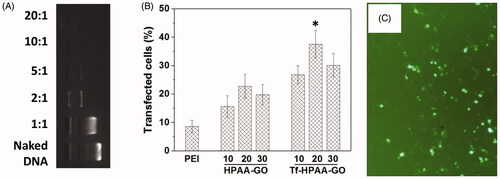
Figure 7. Representative MMP-9 protein expression determined by western blot analysis (A) and its quantitative analysis of MMP-9 protein expression (B) in HNE-1 cells treated with different formulations (n = 3). (1: PBS control; 2: blank Tf-HPAA-GO; 3: PEI-25k/pMMP-9 at a weight ratio of 1.3; 4: Tf-HPAA-GO/pMMP-9 at a weight ratio of 20).
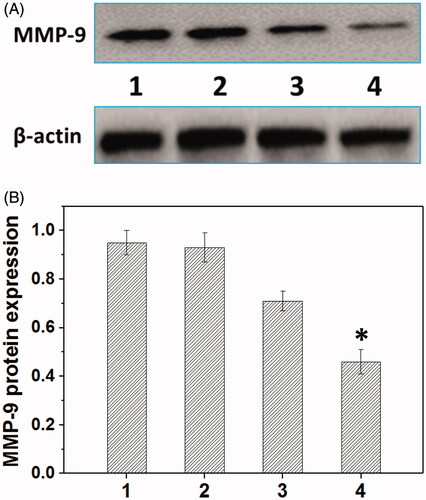
Figure 8. The HNE-1 cell viability treated with different formulations (n = 5) (1: blank Tf-HPAA-GO; 2: Tf-HPAA-GO/DOC (1 µg/well DOC); 3: Tf-HPAA-GO/pMMP-9 (weight ratio of 20, 0.65 µg/well pMMP-9); 4: Tf-HPAA-GO/DOC/pMMP-9 (weight ratio of 20, 1 µg/well DOC, 0.65 µg/well pMMP-9)).
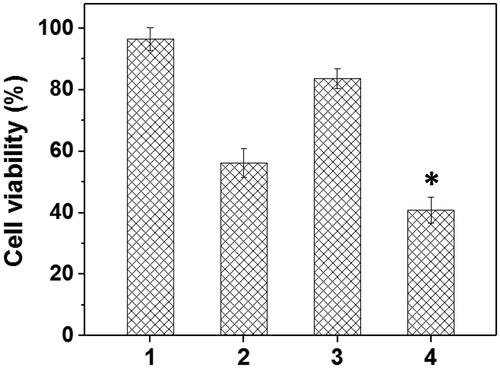
Figure 9. (A) Representative image of HNE-1 tumors at the 21st day and (B) tumor growth profiles treated with different formulations (n = 5). (1: PBS control; 2: blank Tf-HPAA-GO; 3: Tf-HPAA-GO/pMMP-9; 4: HPAA-GO/DOC/pMMP-9; 5: free DOC (docetaxel injection, purchased from Rhone-Poulenc Rorer S.A.); 6: Tf-HPAA-GO/DOC; 7: Tf-HPAA-GO/DOC/pMMP-9).
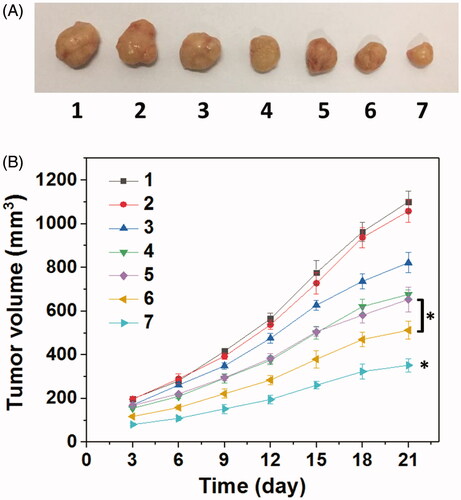
Figure 10. The hemolysis (A) and clotting analysis (B) of Tf-HPAA-GO (n = 5).
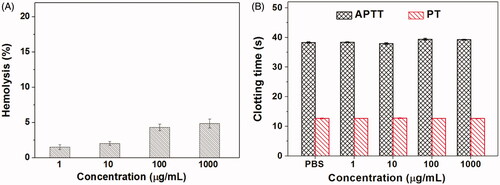
Figure 11. Cytotoxicity of Tf-HPAA-GO to 3T3 cells (37 °C and 5% CO2, n = 5).
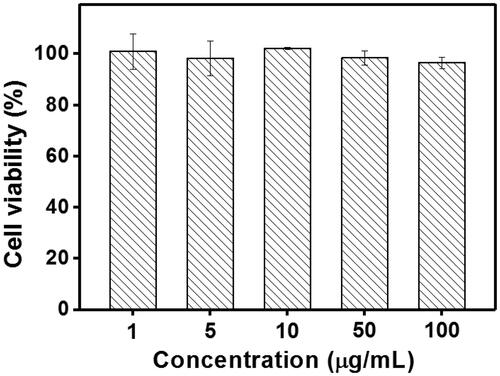
Figure 12. Representative HE stain image of organ histology by Tf-HPAA-GO/DOC/pMMP-9 (top row) and PBS control (bottom row).
