Figures & data
Table 1. Xylometazoline HCl solubility versus degree of saturation (i.e. activity) in two donor formulations; 4.5 wt% Xylometazoline HCl in 65 wt% PEG (aq) gives the same saturation level as 8.1 wt% in PBS.
Figure 1. Effects on drug permeability through porcine nasal mucosa from local origin and storage at −80 °C were studied with donor formulations comprising 2.7 wt% Xylometazoline HCl in PBS. (A) Steady-state flux (1–6 h) across mucosa with respect to site of excision and storage time before use. (B) Cumulative amount of Xylometazoline HCl over time through randomly chosen mucosa membranes (n = 24). Bars indicate confidence interval, p = .05.
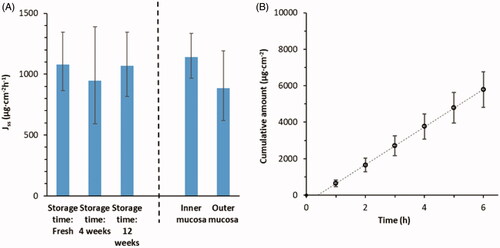
Figure 2. Effect of change in concentration and/or water activity gradient on drug permeability through porcine nasal mucosa. (A) Cumulative amount of Xylometazoline HCl over time obtained from two alternative vehicles, PBS (pH 7.4, aw = 0.996, diamonds) and PBS mixed with 65% PEG (aw = 0.826, crosses) (c.f. ) comprising the same drug concentration, 4.5 wt% (n = 7 and 12 respectively). (B) Cumulative amount of Xylometazoline HCl over time obtained from the same donor formulations as in (A), comprising the same drug activity, aD = 0.68 (n = 6). (C) Effect of increasing the Xylometazoline HCl concentration on drug flux over mucosa with PBS as the vehicle (pH 7.4, aw = 0.996) (c.f. ); the horizontal dashed line indicates the expected drug flux from a saturated solution, aD =1 (n = 6-24). (D) Drug flux plotted against increased of 51Cr-EDTA concentration in water while maintaining a constant 51Cr-EDTA/Na2-EDTA ratio (µg/mg), (n = 2-4). The permeability is depending predominantly on 51Cr-EDTA concentration. Bars indicate confidence interval, p = .05.
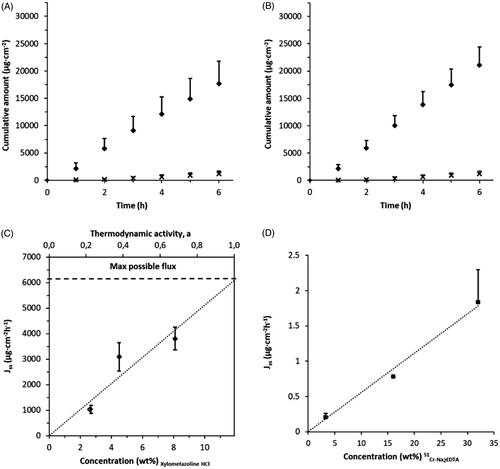
Figure 3. Effect of changing the water activity gradient or composition of formulation on 51Cr-EDTA permeability through porcine nasal mucosa using two alternative vehicles, water (aw ∼ 1) and 65% PEG in water (aw ∼ 0.826) (c.f. ). (A) Cumulative amount of 51Cr-EDTA obtained over time from two alternative vehicles, water (aw ∼ 1, squares) and 65% PEG in water (aw ∼ 0.826, circles) comprising the same drug concentration, 32 µg/mg (n = 3) (c.f. ). Bars indicate 95% confidence interval, p = .05. (B) Fraction of applied 51Cr-EDTA released versus the square root of time from the alternative vehicles in A. Almost all of the supplied 51Cr-EDTA penetrates from the water solution, while less than 20% is absorbed from the PEG-water mixture. (C) Cumulative amount of 51Cr-EDTA obtained over time with increasing Na2-EDTA concentrations from aqueous donor formulations. 51Cr-EDTA/Na2-EDTA- ratios (µg/mg) are shown as 3.2/10 (diamonds), 16/50 (plus signs and black filled circles), 32/0 (circles), 32/10 (triangles), 32/50 (bars), 32/100 (squares) and 32/200 (crosses), n = 2–4 (c.f. ). Lines are appended as guidance for the eye. Significant differences (p < .05) between formulations with increasing 51Cr-EDTA concentrations were shown with one-way ANOVA (p < .05). (D) Fraction of applied 51Cr-EDTA released from aqueous donor formulation with increased Na2-EDTA concentrations versus the square root of time. The total data set shows that 51Cr-EDTA permeation scales with its concentration in the vehicle suggesting no effect of the added Na2-EDTA. There were no significant differences between the curves (p = 1.00) measured with one-way ANOVA (p < .05). N.B. The bar symbol (32/50) overlaps with the square symbol (32/100) in C and D.
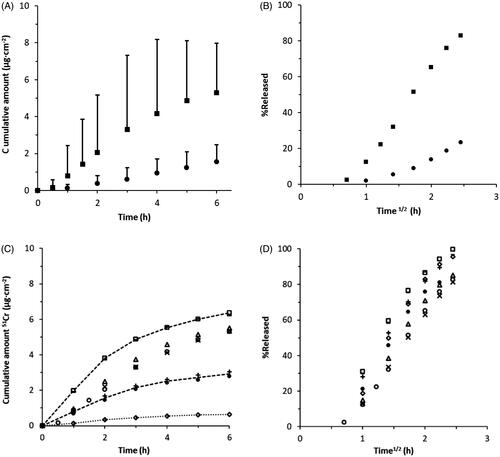
Table 2. Test formulations comprising 51Cr-EDTA are given below together with flux data (Jss) from Flow-through diffusion experiments.
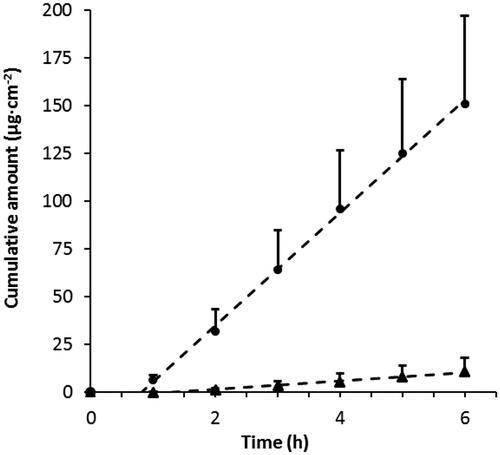
Figure 4. Xylometazoline HCl permeability through porcine nasal mucosa from two commercial vehicles, Nasoferm® (circles, n = 6) and BLOX4® (triangles, n = 3), both comprising 0.1 wt% drug (c.f. ). An independent sample t-test showed a statistically significant difference between Nasoferm® (n = 6, M = 29.5, SD = 12.3) and BLOX4® flux (n = 3, M = 2.4, SD = 1.7), t(Citation7) = 3.68, p = .008).