Figures & data
Figure 1. Optimization of preparation technology. Influence of different weight ratios of β-elemene to PTX on (A) particle size, (B) zeta potential and (C) PTX encapsulation efficiency of two types of microemulsion. n = 4, *p < .05, **p < .01. (D) Influence of different conjugation time on the particle size and the zeta potential of SYL3C/EP-MEs. n = 4, **p < .01.
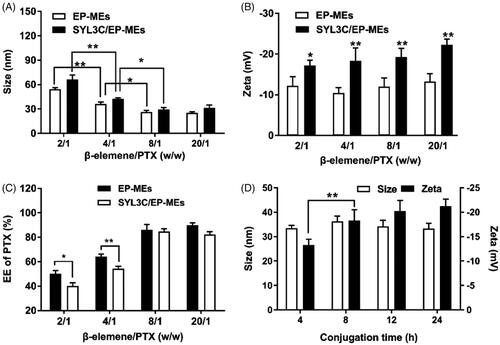
Figure 2. Pseudoternary phase diagrams of SYL3C/EP-MEs at different mass ratio of DOPE&Mal-DOPE-PEG to HS15. M zone represents the area of microemulsion, and G zone represents the area of gel, respectively. 1Smix, 2Smix, 3Smix represent the mass ration of DOPE&Mal-DOPE-PEG to HS15 as 13/7, 11/9, 9/11, respectively.
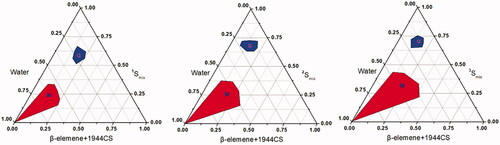
Table 1. Optimized constituents of EP-MEs and SYL3C/EP-MEs.
Figure 3. Evaluation on pH sensitivity of microemulsions. (A) Distribution of particle size and (B) morphology of SYL3C/EP-MEs at different pH values. The bar is 50 nm. Accumulative release of PTX from (C) EP-MEs and (D) SYL3C/EP-MEs at different pH values. n = 4, **p < .01.
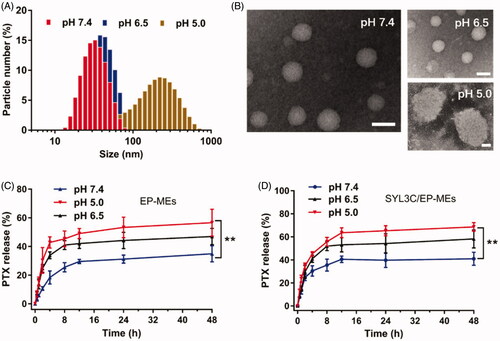
Figure 4. Stability of microemulsions. (A) Particle size and zeta potential of SYL3C/EP-MEs after incubation with serum for different time intervals. (B) Leakage of PTX from SYL3C/EP-MEs at different time post incubation with serum.
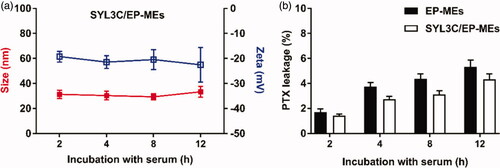
Figure 5. Cellular studies. (A) Immunofluorescence staining of HT-29 cells and NCM460 cells by anti-EpCAM antibody. The bar is 50 μm. (B) Intracellular fluorescence of HT-29 cells after treatments with different FITC-labeled formulations for 4 h. The bar is 200 μm. (C) Intracellular PTX of HT-29 cells after treatments with different PTX formulations for 4 h. n = 4, **p < .01. (D) Cytotoxicity of different formulations against HT-29 cells for 24 h. n = 6, *p < .05, **p < .01.
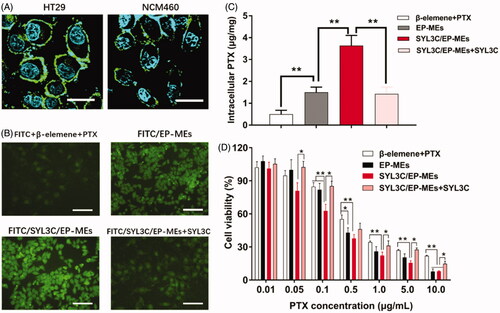
Table 2. IC50 and CI of formulations against two types of colorectal cancer cells (n = 6, ± SD).
Figure 6. Antitumor efficacy in vivo. (A) Changes in tumor volume of mice treated with different formulations within 32 days post-xenograft implantation. n = 12, **p < .01 vs. saline; ##p < .01 vs. β-elemene + PTX; &&p < .01 vs. EP-MEs and SYL3C + SYL3C/EP-MEs. (B) Inhibition of tumor growth of mice treated with different formulations. n = 12, **p < .01. (C) Survival period of mice treated with different formulations during 76 days of observation. n = 8. (D) Changes in body weight of mice treated with different formulations from day 14 to day 36 post-xenograft implantation. n = 12. (E) H&E staining, (F) TUNEL immunostaining and (G) immunohistochemical images of tumor slides of mice after different treatments. The bar is 100 μm.
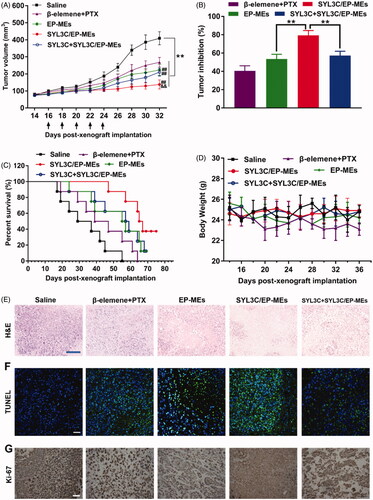
Figure 7. Serum level of (A) IFN-γ and (B) IL-12a of mice after 24 h of the last treatments. n = 4, *p < .05, **p < .01.
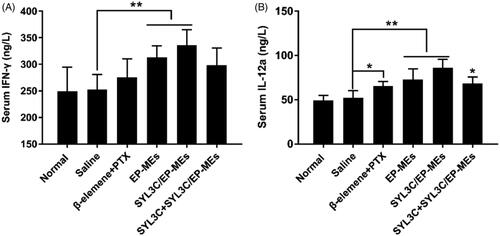
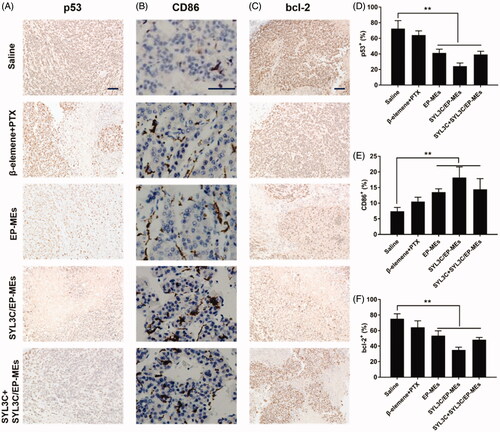
Figure 8. Immunohistochemical studies. Qualification of expression of (A) p53, (B) CD86 and (C) bcl-2 within the tumor tissues of mice after different treatments. Quantification of expression of (D) p53, (E) CD86 and (F) bcl-2 within the tumor tissues of mice after different treatments. n = 4, **p < .01. The bar is 100 μm.